Matching in a case control study in practice
Conceptually the point of matching in case control studies is a pretty basic concept: we can balance a potential confounder in the study design, thereby hopefully mitigating its effects. The two types of matching in case controls studies are individual and frequency. It seems like individual matching is more intuitive to grasp: for each of your cases, select one or more controls (exact ratio is determined from your power analysis) that match the case on one or more characteristics, such as age. Frequency matching on the other hand is not done on the individual per case basis, but rather seeks to achieve a balance in distribution of the matched characteristics between the case and control groups.
Suppose we have two distinct scenarios that we'd like to compare matching approaches. This is for a hypothetical case control study within a hospital. Cases represent some disease state, and controls are those free from this disease. We are sampling from the inpatient population and want three controls for each case.
Scenario #1: Matched on age alone
Scenario #2: Matched on age and length of stay
In the individual matching approach, we may proceed as follows (in pseudo-code):
Scenario #1
- For each case...
- Select a potential control from the pool of controls available.
- If the potential control matches on age (could be the exact age or within some range, like +/- 5 years), consider the matching successful and remove the control from the eligible pool. Make a record of the matched case/control, for example by setting a variable for the case called matched to the unique record identifier.
- If the potential control fails to match, leave the control in the eligible pool and repeat step #2 until a success.
- Repeat step #2 until three successes occur.
- Repeat step #1 until all cases have been matched.
Scenario #2 just requires a slight modification to the first scenario; in step 2a we attempt to match on age + length of stay. If we run out of potential controls than we cannot match on both of these characteristics. This is a limitation of matching on too many variables - lack of comparable controls.
In the frequency matching approach, we have to proceed differently.
First, we need an idea of the distribution of the matching characteristics among the cases. To make this easy, let's consider categorizing the characteristics as follows:
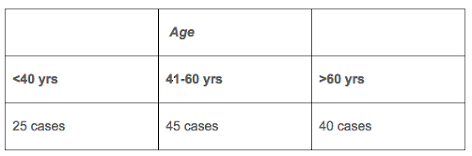
- Age: <40 yrs, 41-60 yrs, >60 yrs
- Length of stay: <5 days, 5-10 days, >10 days
Then we'll do frequency tables for each scenario (I'm making up data at this point, but in practice this should be informed by the known distribution of the cases):
Scenario #1
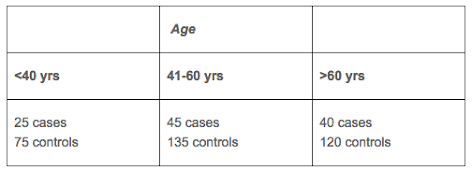
To achieve the frequency matching, we need to draw three controls for each cell:
To implement this in pseudo-code, we may proceed as follows:
- For each category of the matching characteristic (3 in total)...
- Select a potential control from the pool of controls available.
- If the potential control matches on the age category, consider the matching successful and remove the control from the eligible pool.
- If the potential control fails to match, leave the control in the eligible pool and repeat step #2 until a success.
- Repeat step #2 until three times the number of cases are matched.
- Repeat step #1 until all categories have been matched.
Note three important differences from the individual matching approach. First we do not loop through each case, but rather each category of the matching characteristics (or put another we, each cell in the contingency tables we made, <40 yrs, 41-60 yrs, >60 yrs). Second, we do not record matching identifiers because there is no exact match made here. Third, rather than needing three successes in step 3, we now need three times the number of cases in that cell to achieve the 3:1 ratio.
Scenario #2 (again made up data here)
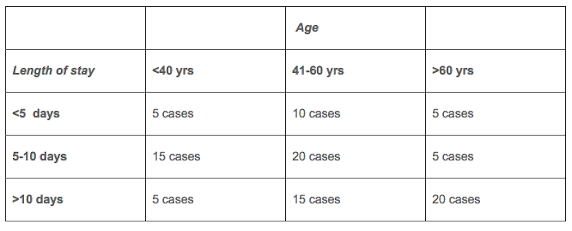
To achieve the frequency matching, we draw three controls for each cell:
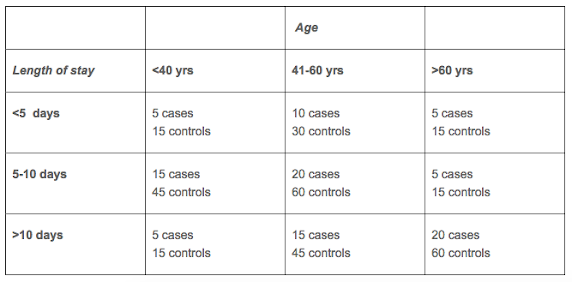
In pseudo-code, we slightly modify the code from scenario #1 to now include the additional categories, 9 in total now (3 age categories * 3 length of stay categories) that need matching. Adding additional characteristics would get unwieldy quite quickly as we then need additional tables stratifying on the characteristics. For example, adding a third characteristic with 3 levels would require 27 cells in the contingency tables to match on (3*3*3).
Unlike an individual matching approach whereby we analyze the data with conditional regression (conditioned on the matching identifier) in a frequency matching approach, we analyze the data in a standard unconditional regression. Regardless of which approach we took for matching, if matching worked and we analyze the matched characteristic(s), we should see no statistical difference between the cases and controls on this variable.
Cite: Goldstein ND. Matching in a case control study in practice. May 4, 2017. DOI: 10.17918/goldsteinepi.