To Bayes or Not To Bayes
I've recently become involved in Bayesian techniques for misclassification correction, much to my initial chagrin. Now, had you asked me a year ago would I ever use Bayesian inference in my work, the answer would have been a resounding no. Frankly, I just didn't get it. But as an advisee in the doctoral program, you pretty much work on what your adviser says you will work on, within reason of course. And the flavor this month was misclassification of self-reported sexuality, using Bayes theorem to correct for the misclassification. Fortunately I had a colleague to collaborate with that was well versed in these methods, and a well-written publication to guide me.
The culmination of this was writing several publications and presenting a seminar on the basics of Bayesian applications to the field of epidemiology. I realized that if I could break it down verbally into digestible pieces, I could probably do the same in writing, so this post became my simple intro to Bayesian inference for the epidemiologist: To Bayes or Not To Bayes. Please, hold your applause. I'll keep the math to an absolute minimum, as I probably don't understand it anyway. But that's also part of my point and intention: to make this very approachable.
The easiest place to begin is simply with Bayes' theorem, which states that the probability of an outcome can be dependent (or conditioned) on something else. It's actually a pretty intuitive concept. Phenomena do not exist in isolated worlds, but rather a system of interactions with many things around them. Bayes articulated this mathematically.
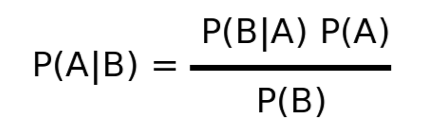
Stated another way, this equation represents a conditional probability of A given our knowledge of B. Ok, great. So how can we use this in epidemiology? Well the simplest answer may be a straightforward observational study. You're given a dataset, the exposure, the outcome, and you're asked to perform some statistical inference to arrive at the association between said exposure and outcome. Let's make this more concrete. Going back to the work that started me down this path, the exposure was being a man who had sex with men (MSM), and the outcome was HIV positivity. So you're given this dataset and asked to now estimate the relative risk of HIV given MSM behavior, represented by this diagram.
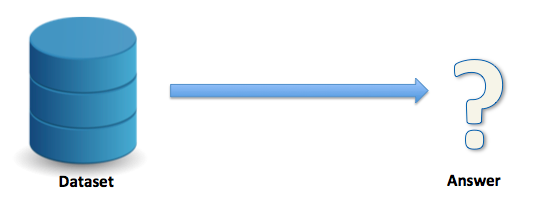
This is what we would call a naive analysis. Your measure of association is specific to this dataset. Well, it's pretty well known that MSM have higher rates of HIV (for example due to more sexual contacts via social networks or riskier unprotected anal sex), so what if you could bring this "prior knowledge" into your world to arrive at a more informed answer?
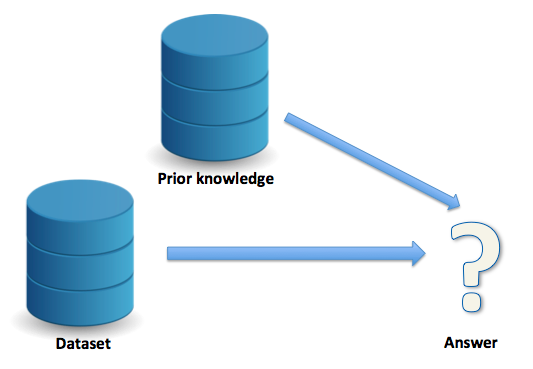
At its essence, this is what Bayesian inference allows us to do. Notice how I said more "informed" answer. You may wonder, is this a "better" answer? Well, that depends. Now I don't mean to use that as a cop-out but more of a caveat emptor, let the buyer beware. As the researcher exploring Bayesian techniques, it all depends on: 1) your assumptions, 2) your implementation, and 3) your interpretation. We'll explore each of these in a moment, but first another example where Bayes' theorem is used and you may not realize it: screening tests.
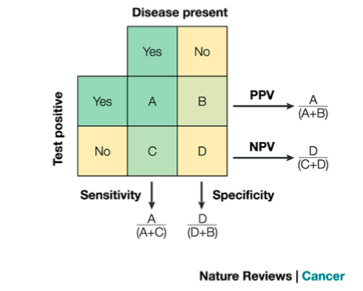
Suppose a screening test had a 99% sensitivity (SN) and a 95% specificity (SP). This tells us the true positive rate (sensitivity) and the true negative rate (specificity) of the test. This is a property of the test itself; it is intrinsic to the performance of the test and has nothing to do with, for example, the burden of some disease or condition in the population. But all you may care about at this point is the answer to one or two questions, namely: (1) If you test positive, what is the probability of it being a true positive? Or, (2) If you test negative, what is the probability of it being a true negative? These questions depend on the prevalence of disease in the population. For example, a highly prevalence disease will mean a greater posttest probability, and vice-versa an extremely rare disease will mean a smaller posttest probability. Specifically, we're talking about the positive predictive value (PPV) of the test for the answer to question (1) above and the negative predictive value (NPV) for the answer to question (2) above.
Notice how I used the word "depend" earlier. This implies some sort of conditional probability, right? Well, as it happens PPV and NPV can be derived via Bayes' theorem. Just to drive home the point, and switch to the vernacular used in Bayesian inference, prevalence of the disease becomes our "prior" knowledge that we've applied to the naïve data (our result on the screening test).
At this point, I'm going to switch gears a little and focus on a specific application of Bayesian techniques: misclassification correction. This should also make sense after the next few paragraphs, but I first need to set the stage for how misclassification is occurring and ways to deal with it.
As I started to introduce earlier, my work was focused on misclassification of MSM. Take this scenario: you are a researcher asking someone their sexual identity, a potentially intimate and possibility stigmatizing behavior. The response truthfulness is likely to vary based on a number of factors. Some of these include, the way you ask the question (e.g., in person versus anonymous computer survey), the venue (e.g., at bar in the gayborhood versus at a church), and the sociodemographics of your respondent (e.g., age or race). There's many more, but my point is that there will be some degree of misclassification here, and this misclassification could bias your analysis.
In general, stigmatizing behaviors may result in "false negatives" responses (lower SN), because the respondent may be trying to obscure his or her identity. On the other hand, you would not expect there to be many (or any) false positives (excellent SP), as why would someone admit to a stigmatizing behavior they are not doing (granted there are exceptions). If we tried to depict this mathematically it may look something like this: SP ~ 1 >> SN.
Since we suspect (or know) this phenomenon is occurring, we may be asked to do something about it. Certainly the easiest option is to do nothing, and just tip our hat to it in the limitations section of the analysis. In fact, this is fairly common. A second option is to try to do something about it in a simple sensitivity analysis, for example using the SN and SP of the measure to do some mathematical correction of the relative risk. You'll generally feel good about yourself because you addressed it, but this can provide wildly different answers than the truth, and in fact can do more harm than good if your assumptions are incorrect. A third option, and I would posit, best answer is to perform Bayesian adjustment via a simulation study. Now we use the SN and SP of the measure but also our prior knowledge about the true relationship to present corrected results. The downside is this requires the most work, but if you're reading this far into the post, I'm guessing you're interested (or really bored). There's a host of other options as well when you believe your results are biased from one reason or another.
Now we'll return to what were briefly mentioned earlier, vis-a-vis assumptions, implementation, and interpretation. Assumptions have to do with your prior knowledge, or the additional information that will inform your current analysis. This is often the trickiest aspect as there may or may not be good data for you to use here. At its broadest, prior knowledge can come from your current dataset (akin to the first diagram above), or external sources (akin to the second diagram above). Let's talk about external sources first; these can include expert opinion or a validation study. A validation study is a study that will provide your prior knowledge on the TRUE relationship between the exposure and outcome, in other words, the association without misclassification. This is what makes prior data so important, and difficult -- it can be hard if not impossible to find this data. And then if you do find this data, you have to address concerns like exchangeability of the study populations (the external data versus your data). So a nice alternative is to use your current dataset to perform an internal validation study (say by randomly dividing the population in half). As its name implies, this serves as your prior knowledge from your own data. Although this is, in my opinion, the best option, it only works if you have a way the TRUE measure in your dataset.
At this point, it is worth noting that if you had the TRUE measure in your dataset, why are you concerned about misclassification? A couple reasons. First, you may not have that TRUE measure available for everyone (say obtaining the true measure is expensive or time consuming) and therefore need to still "correct" for the study participants with whom you don't have the true measure available. Second, you may be demonstrating the phenomenon of misclassification of a given measure to inform other studies; that is, you are providing someone else external validation data from your study.
Practically we often use external data because the TRUE measure is just not available in your data. But wherever the prior knowledge comes from (expert opinion, internal validation data, or external validation data) the next step is to operationalize the priors. In our example, we need to specify prior distributions for: SN of the measure, SP of the measure, and all coefficients of your regression model. SN and SP provide the idea of your misclassification; this can be obtained from your internal validation study (via a simple crosstab of the TRUE measure with the misclassified measure) or via external study (if someone has previously published this information) or from expert opinion. Specifying the coefficients of your regression model is a bit trickier. Take this model for example:

Let Y be our outcome of HIV positivity. Let B1 (Beta 1) be our exposure of interest (MSM), B0 be the intercept, and B2-B5 any potential confounders. Exponentiating B1 will give you the odds ratio of HIV positivity associated with MSM behavior, controlling for B2-B5, compared to non-MSM behavior. This should look familiar; it's your standard logistic regression model. We're really interested in the value of B1 as our prior as that's what we suspect of misclassification, the other parameters let's just assume are perfectly measured (a strong assumption I know). We can therefore obtain the log-odds (value of B1) from our validation dataset, by setting up this model. We now have our prior knowledge: SN, SP, and the beta coefficients.
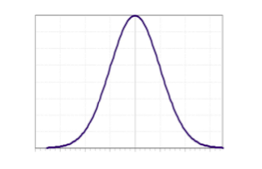
In order to perform Bayesian inference, we need to implement this via a Monte-Carlo simulation study, a fancy way of saying we'll perform the regression modeling over and over in a simulation sampling different values. As simulation studies deal with distributions of data, we'll need to convert SN, SP, and the beta coefficients into distributions. See our description here for more details. We run simulation studies that sample from these distributions, and model the exposure/outcome relationship many thousands of times, correcting for misclassification using equations defined in this book. In the end we end up with a distribution of "answers," and can sample from that distribution to obtain our corrected estimates of the relationship between MSM behavior and HIV positivity. One last word of caution is in the interpretation: we are not providing exact point estimates like you would in a standard regression, but rather a range of plausible values, defined in the credible interval.
Ok, at this point I realize I've spent a long time with the build up and motivation for using Bayesian techniques to write only briefly about the implementation. I refer the reader back to a few of the earlier links in this post for more details, as they deal more with the mechanics of operationalizing this approach. My intention was only to explain the "what" and "why" of Bayesian inference, specifically applied to misclassification correction, not the "how". I'd be curious to hear your thoughts and experiences with Bayesian techniques, so feel free to email me. I may write a follow up if there's enough interest.
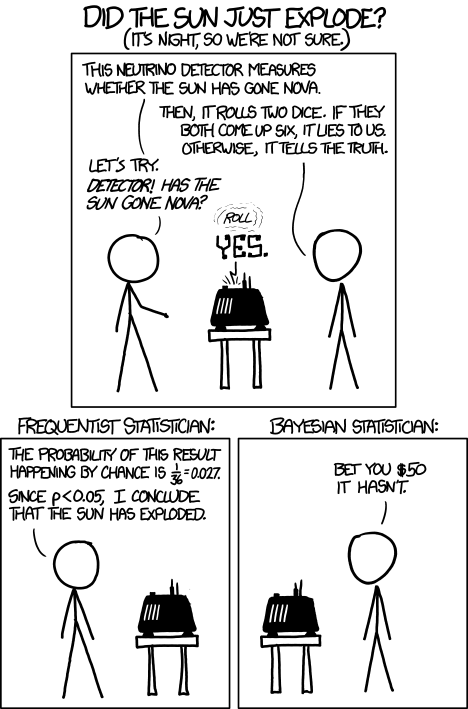
To conclude, I leave you with this cartoon.
Cite: Goldstein ND. To Bayes or Not To Bayes. Dec 16, 2014. DOI: 10.17918/goldsteinepi.