Unmatching a matched case-control study
When teaching my Introduction to Descriptive Epidemiology class, one concept I continually see students struggling with is the notion of a matched case control study, what the matching represents, and how to unmatch the data. It's important to understand conceptually what matching does -- it attempts to account for important extraneous variables that may alter the exposure/outcome relationship. These variables, called confounders, can either be addressed in the study design phase of the study or accounted for in the analytic methods. In a case-control study, it is fairly easy to "match" on a variable, such as age, to rid the data of the age-effect in the study design. (In this post I refer to exact matching to link each case and control together; contrast this to frequency matching where only the distributions of the extraneous variable are balanced). The case and control then become "linked" by this matched variable for the duration of the study, while exposure is assessed. A drawback to this matching approach is you can no longer examine the impact of the matched variable, in our example age, in the analysis because the cases and controls have become balanced in effect on this variable. But that aside, the matched pairs (i.e., the case and control matched by age) are analyzed in terms of their concordance or discordance with exposure. There are four ways this concordance/discordance can occur:
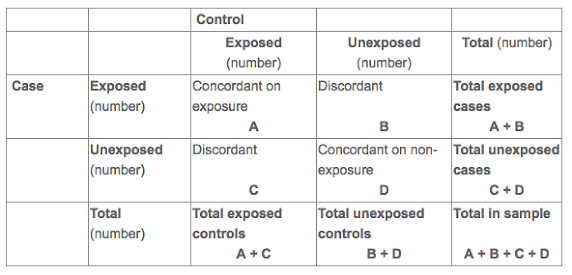
Cell "A" means that both the case and matched control had the exposure. Cell "B" means the case was exposed while their matched control was unexposed, while cell "C" is the opposite of this case. Cell "D" means both the case and matched control were not exposed. To analyze a matched case control study via a 2x2 contingency table, one uses the shortcut formula B/C to compute the odds ratios, that is, the ratio of the discordant pairs.
A feature of matched data is that they can also be unmatched, by unlinking the case from the control. Unmatching may be useful to analyze the data without the confounder accounted for, particularly if you wish to describe the properties of the confounder, which, as you'll recall, cannot be done when the data are matched. Let's use an example (from Chapter 11 of Gordis, Epidemiology, 5th ed.) to demonstrate the unmatching process.
Consider the following data where the outcome is sudden unexpected mortality (a case) and the exposure was smoking 1+ packs of cigarettes per day. The data are presented as a matched case-control study in the table below.
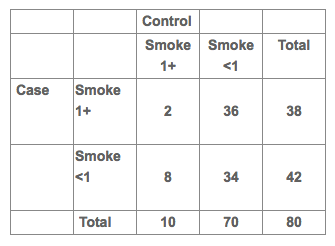
The matched odds ratio (OR) = 36 / 8 = 4.5.
Let's first setup an unmatched case-control contingency table. This is the typical way of presenting a case-control study that most are familiar with:
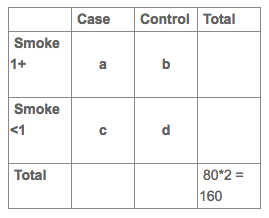
We know there's 80 pairs in this sample, which equals 160 individuals in total (80 cases and 80 controls), so we can fill in the grand total. To figure out each cell (a,b,c,d) in the unmatched table, we need to unpack the matching based upon their exposure history. Each cell in the matched answers the question for each case-control pair (or two people, one a case and one a control who were matched on some characteristic, like age), What exposure patterns did they have?
We have to work through each cell in the matched table to figure out where the individuals belong. The "2" cell says there are two pairs of cases/controls who smoked 1+ pack a day (concordance). This is 4 total people (2 cases and controls). Two of them are cases who smoked 1+ pack and two of them are controls who smoked 1+ pack. Therefore we can add 2 people each to cell "a" and 2 to cell "b".
Next we go to the 36 cell, which says there are 36 pairs of cases/controls where the case smoked 1+ pack and the control smoked <1 pack (discordance). This is 72 people (36 cases and 36 controls). We add 36 people each to cell "a" and 36 people to cell "d".
We can go on to the other discordant cell, and recognize there are 16 people (8 cases and 8 controls) where the control was exposed and the case was not, adding 8 people each to cells "b" and "c". Finally we arrive at the concordant on non-exposure cell, which tells us there are 68 people (34 cases and 34 controls) where both the case and control smoked <1 pack, so 34 people get added to cells "c" and "d".
The final unmatched table should look like this:
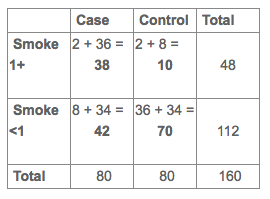
Then we can calculate the OR using the unmatched, individual formula you're familiar with = ad / bc = (38*70) / (10*42) = 6.3.
So, what does this tell us compared to the matched case control OR of 4.5? Two things. First, there appeared to be some degree of confounding present as the ORs differ. Specifically, there was a 40% difference between the matched and crude measures (in general, >10% indicates a possible confounder). Second, the matched variable, e.g., age, was a positive confounder in that it moved the association away from the null (strengthening it in this case).
In practice, it's rare we would compute these calculations by hand, therefore it's more important to appreciate conceptually what the matched pairs represent. Some additional information on matching in case-control studies can be found here.
Cite: Goldstein ND. Unmatching a matched case-control study. Mar 6, 2017. DOI: 10.17918/goldsteinepi.