A Researcher's Guide to Using Electronic Health Records
From Planning to Presentation, 2nd edition
This is the official website for the textbook A Researcher's Guide to Using Electronic Health Records.
As webpages are meant to be, this is a living document and will be updated regularly with new content that I believe is useful to researchers working with EHR data. If you have suggestions for content, relevant articles, or other material in this area, please email me and I may share it here for others. Additionally and in the spirit of transparency and openness, I would like to point out several other books relevant to EHR researchers: Secondary Analysis of Electronic Health Records, Pharmacoepidemiology (esp. Part IIIb, Electronic Data Systems, in the 6th ed.), and Clinical Research Informatics. For those new to EHRs and the practice of clinical documentation, I highly recommend the book Electronic Health Records: Understanding and Using Computerized Medical Records. Although out of print, it can be found easily and inexpensively through any used book seller. The book The Electronic Health Records Specialist also provides a gentle introduction to the EHR geared towards health IT workers who will be supporting the technology.
For those interested in a more formal treatment of the material, I offer an introductory workshop on EHR-based epidemiology at the Society for Epidemiologic Research annual meeting, as well as a free self-paced course via this website.

Data
Use the links below to download a PDF copy of the research planner, source codes in R, and the example dataset.
- Blank research planner (pdf)
- Source codes for all chapters (txt)
- Birthwt dataset (csv)
Errata
As errors are discovered in the text, they will be posted here.
- Ch. 11: Causal inference. Ch. 11 mentions Bradford Hill's criteria for causality. Although the book states these criteria should not be "be viewed as a checklist," the term "criteria" itself may be misleading. Viewing these as considerations may remove the temptation to use this list as a checklist.
- Ch. 12: Natural language processing. Ch. 12 erroneously stated the CLEVER toolkit is not being actively developed. The GitHub repository has changed and the software is still being developed and maintained.
Addenda
This section is used to track updates or additions to the chapters of the book since last publication.
Introduction: Chapters 1-2.
- Ch. 2: Examples of SOAP notes. Typically, a SOAP note will be generated for each patient encounter with a clinician. Using a shortcut template, many clinicians will standardize their particular style of entry, however, while a SOAP note structures clinical documentation from a clinic standpoint, there is still heterogeneity in styles impacting the ability to automatically parse pertinent data. The two boxes below show equally well-written SOAP notes, but with varying degrees of machine interpretability.
Subjective
Jane Doe is 66 y/o who attended her follow-up of her HTN. She feels well. She does not have dizziness, headache, or fatigue. Jane has no history other than hypertension. Her only medication is HCTZ at 25mg per day. Jane has lost 53bs in the past 3 months, following a low-fat diet and walking 10 minutes a day. She drinks two glasses of wine each evening. Jane uses no OTC medications such as cold remedies or herbal remedies.
Objective
Generally, Jane appears well.
Weight 155lbs, Height 55 inches, BMI ~30, Pulse 76 reg, BP 153/80.
She has no lower extremity edema.
Assessment
Jane is here for a follow-up of her hypertension. It is not well-controlled since blood pressure is above the goal of 135/85. A possible trigger to her poor control of HTN may be her alcohol use or the presence of obesity.
Plan
Continue a low-fat diet and exercise. Consider increasing walking time to 20-30 minutes to assist with weight loss. Discussed alcohol use and its relationship to HTN. Jane agrees to a trial of drinking wine only on weekend evenings. Check home BPs. Check potassium since she is taking a diuretic.
Follow-up in the clinic in 1 month. Bring a blood pressure diary to that visit. Consider adding ACE inhibitor at the next visit if BP is still elevated.
Source: https://www.carepatron.com/blog/15-soap-note-examples-and-templates-healthcareS: 42 yo woman presents with pale skin, weakness, dizziness, and epigastric pain. 2 weeks ago she experienced decreased exercise tolerance. She takes frequent doses of antacids and uses ibuprofen 200mg prn headaches. NKDA. She has children age 15, 12, and 1.
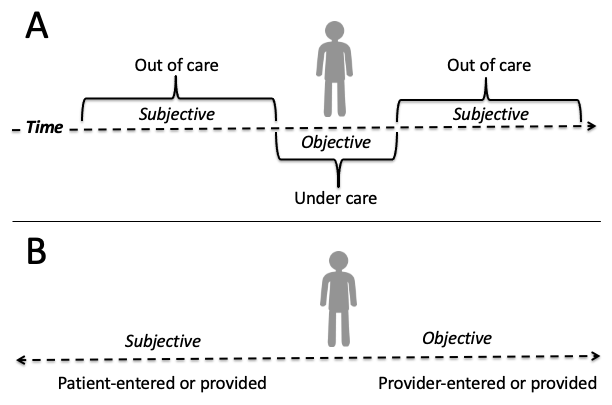
Researchers who are accustomed to working with sociodemographic, economic, or other "social determinants" typically obtained via a "baseline" survey in an epidemiological or clinical study may find the subjective portion of the SOAP note especially useful. The subjective portion may be further structured as past medical history (conditions, injuries, medications, surgeries, etc.), family medical history (diseases, health factors, genetics, longevity, etc.) and social history (personal and behavioral factors, such as diet, exercise, smoking, drug and alcohol use, etc). This is also where researchers will find self-reported symptomology at the outset of a current illness as well as outcomes of previous medical treatments. There are several challenges with these data. First, documentation in this section of the SOAP note is more likely to be free text than a discrete, coded entry in the EHR, discussed in detail in chapters 3 and 12. Second, as the 'S' in SOAP implies, this is self-reported data and the accuracy of these data will need to be validated, discussed further in chapter 6 and 9. The figure below depicts the spectrum of subjective (i.e., patient-provided) versus objective (i.e., provider-ascertained) data that may be captured in the EHR. When a patient is under care with a provider, the data tend to be the most objective while anything ascertained before or after a given encounter is largely going to be self-reported.
O: T 38 C, RR 18, BP: sitting 118/75, standing 120/60, HR: Sitting 90, standing 110. Hb 8gm/dL, Hct 27%, platelets 300,000/mm3, retics 0.2%, MCV 75, serum iron 40mcg/dL, serum ferritin 9ng/ml, TIBC 450 mcg/dL, guaiac stools. Cheilosis at corners of mouth, and koilonychias at nail beds. PMH: peptic uler and preeclampisa with last pregnancy. Dx: iron-deficiency anemia.
A:
1. Fe: counsel parent on tolerance and side effects
2. Discuss guaiac stool and ibuprofen, f/u with PCP on GI bleed, possible ulcer. d/c ibuprofen, use APAP prn HA.
P:
1. Iron sulfate 325mg TID x 6 months - f/u with PCP for retic count after 7 days of therapy. counsel/educate patient on a) take on empty stomach if possible, ok with food if cannot tolerate, b) separate iron dose from antacid dose, c) iron can cause constipation and darken stool color, d) keep iron out of reach from children - toxic.
2. Make appt with pcp for probable ulcer/GI bleed. d/c ibuprofen, take acetaminophen 500mg po q 4-6 h prn p, NTE 4000mg/24 h (counsel on liver toxicity)
Source: https://sop.washington.edu/wp-content/uploads/Student_SOAP_Note_Primer.pdf - Ch. 2: Terminology and coding standards. In the U.S., the Centers for Medicare & Medicaid Services is the largest payor of healthcare services: "Nearly 90 million Americans rely on health care benefits through Medicare, Medicaid, and the State Children's Health Insurance Program (SCHIP)." As such, CMS has a large influence over documentation and billing practices in the EHR that relate to reimbursement, such as the use of DRG (inpatient) and APC (outpatient) codes.
Evaluation and management (E&M) codes, based on CPT codes, are used for professional service reimbursement, such as to bill for a new patient visit or hospitalization, an established patient visit, or a consultation, and take into account the complexity of the encounter. There are four components of E&M codes: 1) patient type whether new or established, 2) patient history, 3) examination findings, and 4) extent of medical decision making. E&M codes are distinct from diagnostic codes but may be billed in tandem with ICD, DRG, or APC codes. For health services researchers, important details on patient encounters may be embedded in the E&M codes but not captured elsewhere in the medical record, which again demonstrates the complexity of operationalizing clinical phenotypes from EHRs.
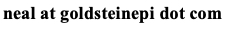
Another way to conceptualize the various terminologies used in medicine is by dividing them into codes used for documenting the clinical encounter and order entry and codes used for reimbursement and reporting, although these are not mutually exclusive. Codes to document the clinical encounter and order entry tend to be more granular and invisible to the end user. These vocabularies/taxonomies include SNOMED-CT, MEDCIN, LOINC, and array of medication terminologies such as NDC (FDA), ATC (WHO), GPI (Medi-Span), AHFS (ASHP), and GCN (First DataBank). Codes to document reimbursement and reporting tend to be more general and visible to the end user, which is why many providers can quote specific ICD codes. These include ICD, CPT (especially E&M codes), DRG/APC, and HCPCS (CPT is a component). Many EHRs have nomenclature/vocabulary crosswalks that map internal clinical concepts to ICD codes for billing purposes, and the external UMLS/I-MAGIC/RxNorm systems help with mapping between a variety of these vocabularies.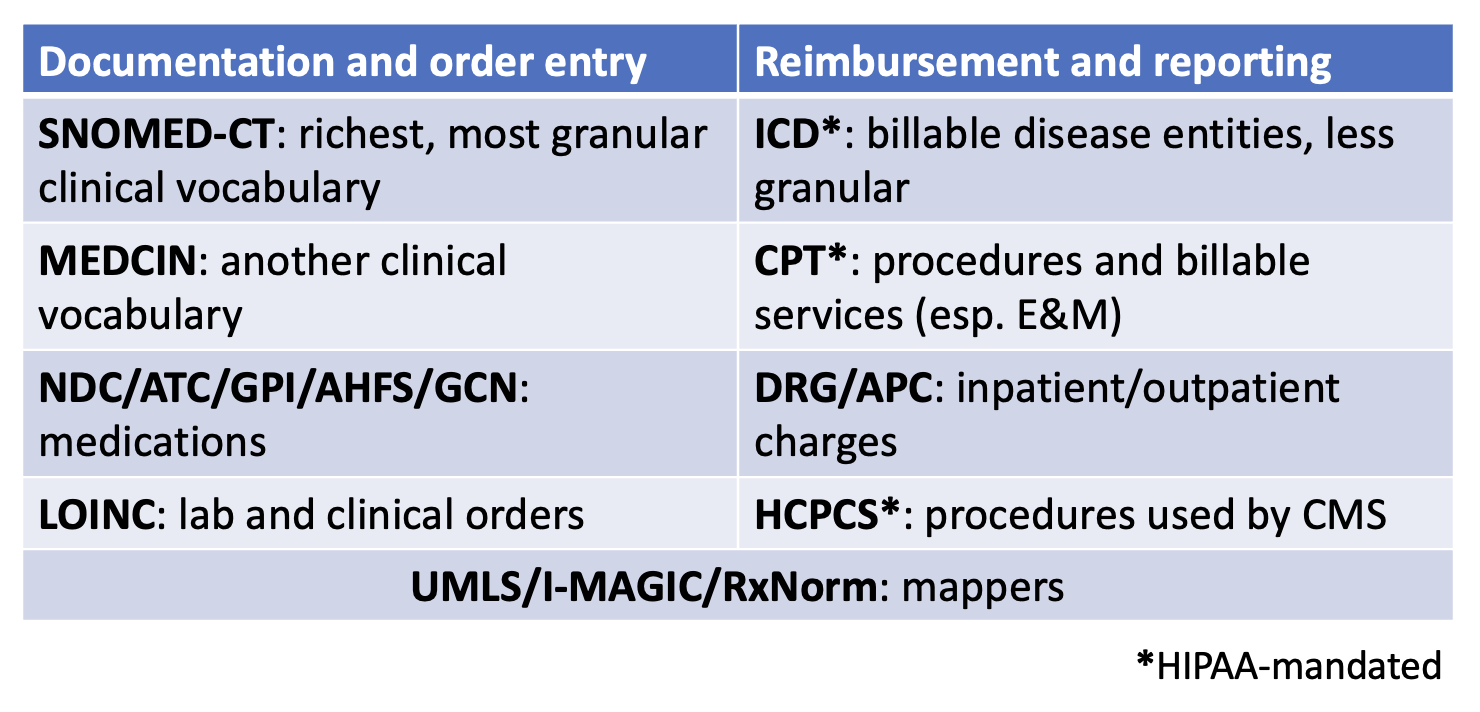
Yet another way to approach categorizing the standards and vocabularies encountered in the EHR is by the data type. Demographics and encounter data may draw from EHR vendor-specific terminologies or HL7 vocabulary, Diagnoses most commonly are mapped to ICD codes, sometimes SNOMED, Procedures may use ICD, CPT, or HCPCS, Medications can use an array of vocabularies including RxNorm, NDC (FDA), ATC (WHO), GPI (Medi-Span), AHFS (ASHP), and GCN (First DataBank), and Lab results and clinical findings often use LOINC or a lab-specific terminology. Of course all of these are subject to variation by EHR vendor, geographic region, and healthcare system preference.
One final point about payors in EHR data, the primary payor may not be available at the time of discharge due to the reimbursement process. Thus EHR data on payor may be incomplete, or there could be a mismatch between the insurer as recorded in the EHR and the payor ultimately responsible for reimbursement. In such cases where payor is essential to analyze for EHR projects, the use of billing systems and/or insurance claims database are likely more accurate and complete. - Ch. 2: Understanding ICD codes. There are numerous resources available for EHR researchers to find and understand ICD codes; this section provides a high level overview for ICD-10-CM. ICD-10-CM codes will always be between three and seven alphanumeric characters in length. The first character is always a letter, the second character is always a number, and characters three through seven can be either letters or numbers. Following the third character will always be a decimal and the more characters in the ICD code, the more specificity of the code. Coders are required to use the most specific code that is applicable. Broadly, ICD codes are categorized by chapter, grouping diagnoses and clinical findings by subject such as organ system, pathologic process, and other causes of illness and injury. For example, codes C00-D49 relate to neoplasms, codes J00-J99 relate to diseases of the respiratory system, and codes O00-O9A relate to pregnancy and childbirth. Characters four through six define the site, etiology, and manifestation or state of the disease or condition. For example, while C15 is a malignant neoplasm of the esophagus, C15.3 stipulates that the neoplasm was in the upper third of the esophagus. Some codes allow for a seventh character extension that defines aspects of the clinical encounter, such as initial encounter, subsequent encounter, or disease sequela. Researchers operating a clinical phenotype using ICD codes should use both the chapter and anatomic site, depending on the research goal. Incorporating both allow for a more precise and focused phenotype. On the other hand, when this detailed specificity is not needed for the research aim, matching on the first three or four characters in the ICD code may be sufficient. ICD-11, which came into effect worldwide in 2022, substantially changes ICD-10-CM codes, but as of this writing has not been adopted in the U.S. As discussed elsewhere in the book, research projects spanning multiple years may need to reconcile changing standards. Further, regardless of the vocabulary used, matching on ICD codes introduces the possibility of misclassification, discussed further in chapters 6 and 9.
The Agency for Healthcare Research and Quality's Clinical Classifications Software may be useful for EHR researchers working with many ICD codes in their study. This software reduces the complexity of ICD to a core set of clinically meaningful categories. Another benefit from this software is the ability to create a clinical phenotype from ICD codes as well as map across ICD code transitions. One decision that must be made in advance is whether the researcher is identifying patients who have been diagnosed with a condition or for a condition. For example, someone may be hospitalized for COVID-19 or may be hospitalized for chest pain but also have COVID-19. This difference may be discernible via the ICD codes -- oftentimes there is a primary diagnosis or reason for hospitalization code. Thus the phenotype may draw from the primary ICD code and/or any ICD codes. Defining the phenotype is discussed in chapter 4. Regardless, comparing the analyses using both approaches would be an appropriate sensitivity analysis. - Ch. 2: EHR concepts. The EHR exists as both a technology and a tool. By technology, we mean that it is a generalized platform for managing the health of a patient and for providers to be reimbursed for the care provided. The EHR aggregates and displays data from multiple areas including people (e.g., healthcare workers and patients), places (e.g., clinical departments such as radiology and pharmacy), and things (e.g., medical devices or wearables) (see Figure below).
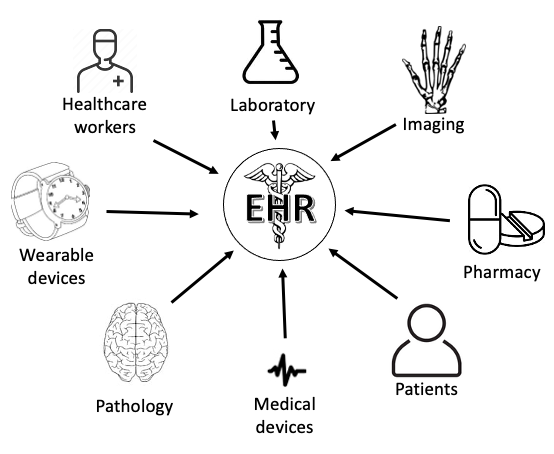
As a tool, the EHR encompasses a host of applications that are embedded within the system. These core modules include schedule, patient registration (admission, discharge, transfer), clinical documentation and charting, medical billing and charging, clinical decision support systems (CDSS) and computerized physician order entry (CPOE), electronic medicine administration record (i.e., barcode scanning of medications at the time of administration), communication, and ancillary functions such as interfacing (w/ other systems), reporting, and administration. Truly, these are complicated systems as exemplified from this simplified view of the Veterans Health Administration VistA architecture (Source: https://commons.wikimedia.org/wiki/File:VA_VISTA_Architecture.png).
To expand on two of the more important modules in the EHR, namely CDSS and CPOE, the goals of these tools are to reduce errors, reduce costs, and limit practice variation under the evidence-based medicine paradigm. This is achieved by improving the structure and legibility of medical documentation, identification of pertinent medical details, and real-time feedback to providers. Such feedback may incorporate checks for patient or drug allergies, drug interactions, extreme doses, or flag potential drug-lab problems. While such alerts are the most famous - or perhaps infamous depending on your perspective - aspect of CDSS and CPOE, these technologies also enable computer assisted interpretation of labs and imaging, efficient consultation and messaging with specialists, critiquing of data entry to ensure proper data are captured, and automated teaching modes for trainees. - Ch. 2: Distinction between inpatient and outpatient EHR data. As a general rule we can say that outpatient notes tend to mostly be written by physicians whereas inpatient medicine, due to its team approach and complexity, tend to mostly be written by nurses, techs, and allied health professionals, with comparatively fewer physician notes. The volume of data in the inpatient EHR far exceeds that of the outpatient EHR, although as a reminder, the inpatient data presents a brief snapshot of a patient's life compared to the longitudinal outpatient record.
- Ch. 2: Medical scribes. Increasingly, artificial intelligence is being used as a medical scribe. This can introduce its own bias into the medical narrative: "We did identify some hallucinations in these drafts of the clinical notes. We were finding that they were oftentimes in the plan section [of the SOAP note]." Some EHRs may flag content that was generated with AI; this indicator would be useful for the researcher to validate the accuracy of AI versus non-AI generated content.
- Ch. 2: Descriptive, predictive, and causal models. EHR data can be used for all three purposes. In a recent article on this topic, the author describes four areas of improvement for investigators conducting such work.
- Ch. 2: Database concepts. It's worth distinguishing between database models for EHR researchers who directly interface with these databases, e.g. data retrieval or reporting purposes. There are many models of database architecture, but in general EHR vendors seem to prefer two types: hierarchical and relational. The immunization database example given in Ch. 2 of the book is a relational database. Each construct -- patients, vaccines, providers -- is housed in its own table, with linkages between tables accomplished by unique identifiers. Relational databases optimizes data retrieval over performance. Hierarchical databases, on the other hand, value performance over data retrieval. In a hierarchical database, data are nested in a hierarchy that does not require linkage across different tables.
For readers familiar with the architecture of Epic's electronic health record platform, the Chronicles database is a hierarchical data model. At the top level are "master files" that catalog various types of data, such as details on patients, procedures, and providers. There are hundreds of these master files prefixed by their initials (INI). Within the patient master file, an INI abbreviated as EPT, one would find a "record" for each patient who has ever been entered into that EHR. As can be imagined, this master file can grow to be extremely large. At the next level down in this hierarchy, for each patient record we would find "contacts" for each encounter a patient had with the healthcare system: these could be office visits, inpatient admissions, telephone calls, electronic communications, etc. It is not until we get down to this contact level where we would find the individual data elements/items we as researchers would be interested in extracting. A library analogy has been used to describe this type of database, where each master file is a book, each record is a chapter in the book, and each contact is a page in the chapter. The entire library of books is the database. Recognizing a need to make data easily accessible to analysts and researchers, Epic's Clarity and Caboodle databases are relational models, and are where reporting tools such as SlicerDicer would traditionally query from.
Section I, EHR Data for Research: Chapters 3-6.
- Ch. 3: Framework for EHR research. El Burai Felix et al. described a standardized framework for evaluating data from large healthcare databases, including EHRs, in a 2024 CDC Morbidity and Mortality Weekly Report. Based on a comprehensive review of existing literature and frameworks, they distill to 4 components that researchers should consider when conducting an EHR-based study: 1) engage with stakeholders and define the goals of the EHR research, 2) identify how the EHR data will be accessed and assessed, 3) standardize the process of data collection and analysis, and 4) discuss findings with stakeholders.
- Ch. 3: Socioeconomic status, Ch. 4: Non-EHR data, and Ch. 5: Linking census data. Measuring socioeconomic status (SES) is an ongoing challenge in EHR-based research. Traditionally, investigators have relied on proxies measured and linked via the ZIP code of the patient's EHR address. The HOUSES index (HOUsing-based SES) addresses this limitation by moving beyond ZIP code based proxies using characteristics of the individual residential address to infer SES. This program is managed by the Mayo Clinic Precision Population Science Lab and users incur a fee to access. Additionally, this requires individual EHR addresses, which then presents the challenges associated with these data as described in chapter 6.
- Ch. 3: Responsible conduct of EHR research. Many organizations subscribe to the Collaborative Institutional Training Initiative Program (https://www.citiprogram.org to provide training content on responsible conduct of research. Such training must be completed prior to undertaking human subjects research, even if IRB-exempt de-identified EHR data. A typical course of study for a new researcher would likely include: 1) an introduction to the Belmont report, history, and ethics of research, 2) an overview of risks associated with secondary data research, 3) consideration of special or at-risk populations, 4) HIPAA and privacy considerations, and 5) identifying conflicts of interest.
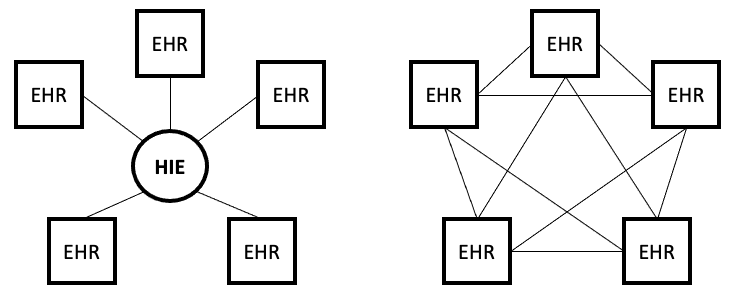
- Ch. 3: Data sharing models. An emerging technology, known as blockchains, may allow for secure and private sharing of EHR data. An overview of this technology and its application to healthcare and EHRs may be found in McGhin et al. (2019) and Han, Zhang, and Vermund (2022). What makes this technology especially appealing and relevant to EHR researchers is the ability to potentially retrieve data across disparate EHRs. This is similar, in promise, to what health information exchanges (HIEs, discussed further in chapter 4) set out to do, at least from a clinical view. Yet blockchain sharing of EHR data can be considered the opposite of the traditional HIE models. Whereas HIEs are centralized networks of information sharing because the HIE acts as the single authority, blockchains are a completely decentralized network for peer-to-peer exchange of health data (see Figure below for comparison). Nevertheless for this to be realized will require 1) healthcare systems to opt into the blockchain model, and 2) specific provisions are included for secondary uses of de-identified data for research purposes. This will take great political and economic capital.
Blockchain technology is in fact already in use in healthcare. Schmeelk et al. (2022) reviewed the published literature for adoption of blockchain technology into EHRs and identified five relevant use cases. Additional use cases may be found in McGhin et al. (2019). To expand on one use case, ACTION-EHR is a blockchain framework for sharing for radiation oncology data across disparate EHRs. There are both provider and patient interfaces to the system, and any collaborating entities must install the relevant blockchain technology. This is one of several such frameworks proposed in the literature, e.g., see also Abunadi and Kumar (2021), - Ch. 3: Commonly requested EHR data elements. Chapter 3 includes an EHR research data planner, but there are likely to be a certain subset of commonly used data elements across most EHR-based research projects.
- Patient-level
- Patient ID/MRN
- Sex or gender
- Race
- Ethnicity
- Patient DOB and DOD (if deceased)
- Encounter-level
- Encounter ID
- Encounter date/time
- Encounter type
- Encounter location
- Insurer/payor
- Age at encounter
- BMI
- Reason for visit/hospitalization
- Comorbidities or index
- Length of stay (inpatient)
- Diagnoses: ICD codes, primary + secondary
- Procedures: CPT codes
- Medications: names, class, dose, route of administration
- Labs: tests ordered, dates, results
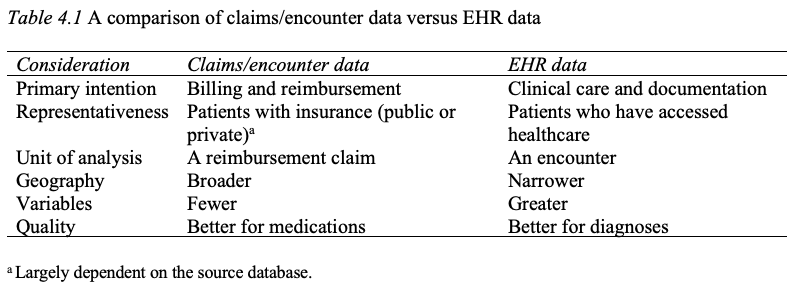
- Ch. 4: Distinction between claims data and EHR data. Several other important distinctions between claims data and EHR data are the quantity and quality of variables for the researcher. In general, claims data are more limited in terms of the number of variables captured compared to the EHR. For example, while claims data may capture whether a patient fulfilled a medication order, it will not indicate whether the patient has taken the medication, which may be captured in EHR data should a clinician inquire during a follow-up visit. On the other hand, the quality of claims data for medications may be superior to EHR data, given the scrutiny that claims data receive from insurers. Yet disease and diagnosis data are likely better in the EHR as medication reimbursement depends less on an accurate diagnosis, especially in the outpatient setting. Below is an updated Table 4.1 to reflect these additions. Further detail on claims (also known as encounter or administrative) databases may be found in Ch. 12 in the 6th ed. of Pharmacoepidemiology (Gerhard et al., 2020), including a table contrasting characteristics of common claims databases in the U.S. (see Table 12.1 in Gerhard et al.). An overview of commonly used population EHR databases may be found in Chs. 13 and 14 in Pharmacoepidemiology.
One family of claims databases, the Agency for Healthcare Research and Quality's Healthcare Cost and Utilization Project (HCUP) deserves particular mention as the largest collection of longitudinal hospital care data in the U.S. These databases contain encounter-level information for all payers nationwide and participating states from 1988 including inpatients (adult and children), emergency departments, and outpatient surgery and services. With the availability of multistate EHR databases, researchers have explored the overlap between claims databases and EHR databases. One such study reported similar demographic and clinical representation, with the exception of psychiatric/behavioral and obstetrics/gynecology diagnoses, which were reported less frequently in the EHR data. Other researchers have validated linked claims-EHR prescribing data and observed marked similarities. Importantly, neither of these sources should be viewed as the "gold standard" given these systems exist for different purposes, none of which are research.
Schneeweiss, Desai, and Ball (2025) examined claims and EHR data from three perspectives: data continuity, data granularity, and data chronology. In terms of data continuity, they noted how claims data can be used to mitigate the fragmentation of healthcare delivery in the U.S.; in other words, to fill in the missing data inherent in single institution EHRs. Data granularity is superior in EHRs and thus linked claims plus EHR data provides the most comprehensive view of a patient's given health state and treatment. Finally, they observed that chronology (i.e., temporality) is a particular strength of claims data, especially when patients fill a prescription, whereas the EHR typically captures the date a medication (or procedure, lab, etc.) was ordered. Figure 1 in Schneeweiss, Desai, and Ball depicts how one may operationalize a longitudinal pharmacoepidemiology research study combining claims and EHR data. In a related concept, observability of EHR data may also be estimated in the EHR when a fully observed external data source, such as claims data, are available. Unlike the data the EHR-claims continuity approach, the observability approach only requires overlap in covariates and not direct patient linkage between the EHR and claims data. Meanwhile, in situations where claims data (or another fully observed external data source) are not available, researchers have developed predictive models of data continuity based only on the institutional EHR. (This material is also relevant to chapters 6 and 9 on catchment and bias.)
Regarding the representativeness of claims data, researchers have compared how a commericial insurance database (Merative MarketScan) compared to a presumably more complete and objective gold standard derived from the AHRQ's HCUP data. While limited to only inpatient procedures in select states, their findings showed underestimation of procedures by an averaged 28.5% in MarketScan (i.e., imperfect sensitivity). This estimation problem exhibited patterns by neighborhood deprivation: high neighborhood deprivation led to higher underestimation whereas areas of low deprivation had an overestimation problem (i.e., imperfect specificity). The conclusion is that 1) commercially insured patients were less likely to have inpatient procedures than noncommercial patients and 2) third-party insurance databases that include commercial patients are more likely to have imperfect sensitivity because they are underestimating the noncommercial insurance procedures. This may be explained as by the assertion that commercial insurance underestimates procedures since procedures are more common in older patients covered by Medicare. - Ch. 4: Health information exchanges. In addition to traditional government-funded HIEs that focus on specific jurisdictions, there are also nonprofit HIEs that seek to connect healthcare practices and systems in a jurisdiction-agnostic approach. For example, the CommonWell Health Alliance is a network of over 30,000 clinical sites across all 50 states covering approximately 200 million patients. The U.S. Department of Health and Human Services is also supporting the goal of nationwide health data access through qualified health information networks. In short, this initiative seeks to define the technical infrastructure and common information exchange principles to interconnect HIEs. Encouragingly, one of these principles (Principle #7) specifically encourages the use of HIEs for supporting population health research.
Conversely, some argue the way forward is not through a nationalized HIE, but rather each state (or sub-jurisdiction) transforming their HIEs into what are known as health data utilities (HDUs). As opposed to HIEs, which focus on a traditional model of health care delivery, HDUs can aggregate clinical and non-clinical data and curate representative health datasets that could be used for research and development activities. - Ch. 4: Aggregated EHR data. Since the 2nd edition of this book was published, there has been a proliferation of aggregated EHR data platforms available to researchers. Several of these are described in this chapter under the heading "Non-institutional EHRs." New resources that have proven quite popular include government-backed initiatives such as the National Institutes of Health All of Us research program, EHR vendors such as Epic's Cosmos (Epic Systems Corporation, Verona, WI), and third party companies such as TriNetX (TriNetX, LLC, Cambridge, MA). A discussion of the benefits and challenges of these resources for clinical and public health research may be found in Goldstein, Olivieri-Mui, and Burstyn (2025).
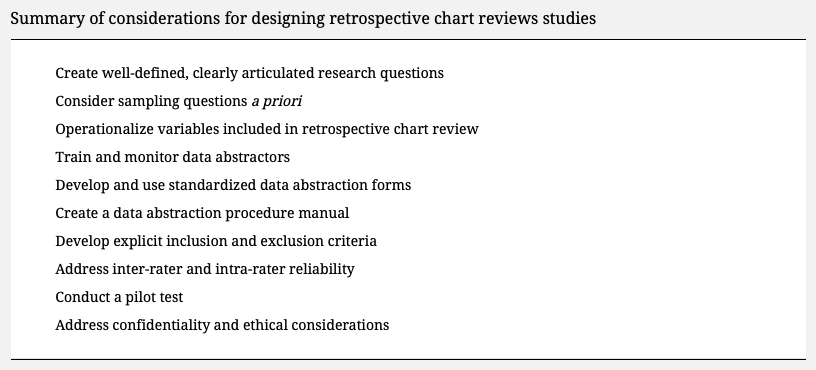
- Ch. 4: Manual chart review. For those undertaking a manual chart review to derive a research database, Vassar and Holzmann (2013) assembled a list of ten best practices to follow to avoid mistakes in the retrospective chart review. (Source: https://pubmed.ncbi.nlm.nih.gov/24324853/).
- Ch. 4: Multi-institution EHR studies and Ch. 11: Correlated observations. Each healthcare system has a catchment process that is multifactorial (see catchment definition below). A consequence of this is that patients within a given EHR may be more likely to be similar to each other than patients between multiple EHRs. This introduces a modeling complexity since the errors in an ordinary regression would be correlated. Thus, the analytic modeling strategy should test this hypothesis, and if found to be true, employ a multilevel hierarchical model with patients clustered within their respective EHRs (i.e., healthcare systems).
- Ch. 4: Further defining types of clinical free text. There are a variety of clinical free text notes and reports relevant to the EHR researchers. At the broadest level, we can define an encounter note to be the free text documentation that resulted from a patient encounter. One type of encounter note is the progress note, which is ongoing longitudinal documentation of a patient's health state. Progress notes may be documented in the inpatient setting or the outpatient setting. In the inpatient setting progress notes may also be accompanied by an admission note, which identifies the reason for hospitalization along with the admitting clinician's finding(s), and a discharge summary, which provides an overview of the hospital admission including diagnoses, treatments, procedures, and a post-discharge care plan. Other types of clinical free text include consultation notes when specialists are involved in care, referral notes when a patient is referred for care elsewhere, and nursing notes which tracks nursing care (sometimes documented in SOAP format). Aside from free text encounter notes, free text is also commonly found in reports from speciality care or services. For example an operative report details surgical interventions, a radiology report captures the results of an imaging procedure, and a pathology report summarizes histological or pathological findings. The research aims will determine which notes or reports are most relevant. For example, if attempting to operationalize a clinical phenotype or risk factor present upon admission, one would consider the admission notes, nursing notes, or progress notes only from the first hospital day, but not progress notes or discharge summaries generated after the first day of hospitalization. The website MTSamples includes a large number of example free text notes in different specialities and may be useful for researchers to get a sense of the type of information captured in unstructured data.
Aside from the notes, another popular source of free text for pharmacoepidemiologists is the medication signatura (sig). The medication sig contains information on the patient; medication, strength, amount, route, and frequency; amount to be dispensed and refilled, if applicable; and the ordering provider. There are many abbreviations and shorthand used in writing the sig. Even though electronic order entry has helped to improve medication ordering (esp. from handwritten orders), there is still heterogeneity, especially when it comes to the free text components of the sig. To see several screenshots of the medication history from a pediatric EHR, follow this link. As you will observe, it places a burden on the EHR researcher with how to operationalize these data. As another example, consider this sig for a tapering dose of predinsone: "Take 60 mg (6 tablets) once daily for 3 days, then 40 mg (4 tablets) once daily for 3 days, then 20 mg (2 tablets) once daily for 3 days, then 10 mg (1 tablet) once daily for 3 days, then stop." Not only is this a challenge for string parsing, any dose-variable is time varying increasing the complexity of the NLP. - Ch. 4: Accessing non-text EHR data. As more non-text data make their way into the EHR, epidemiologists may be interested in operationalizing these data in their research datasets. Examples of such data include medical images (e.g., radiographs), physiological signals and patient telemetry (e.g., ECG, EEG, EMG), wearable devices, anatomical and annotated drawings (esp. dermatology and ophthalmology), audio, video, scanned reports, and so on. Consider the challenges in operationalizing measures of cardiac function from the preoperative cardiac catheterization figure below (Source: https://pubmed.ncbi.nlm.nih.gov/22073326/).
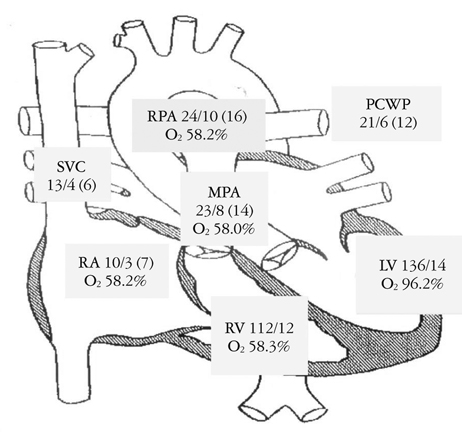
There are technological challenges with creating textual representations of these data, but solutions due exist such as optical character recognition for scanned reports and artificial intelligence algorithms for creating meaning out of images, but these tools must be validated before widespread use. Without these tools, researchers may be left to rely on meta-data that accompanies these images. For example, the Digital Imaging and Communications in Medicine (DICOM) standard defines the digital storage and structure of many types of medical images. Embedded in the DICOM file are meta-data that describe the patient, image, and, in some cases, clinical findings. To obtain these data, researchers would need to interface with the Pictures Archive and Communication System (PACS), query the patient, exam, and corresponding medical image(s), and use a DICOM reader to extract the pertinent meta-data. - Ch. 4: Clinical Data Interchange Standards Consortium. Another relevant information exchange standard that EHR researchers may wish to be familiar with is the Clinical Data Interchange Standards Consortium (CDISC). Although this standard is largely specific to regulatory studies, as these types of studies interface with the EHR, data extracts may be created that conform to this standard, potentially useful to researchers.
- Ch. 4: OHDSI and the Common Data Model. The Observational Health Data Sciences and Informatics (OHDSI) ecosystem centers around its Common Data Model (CDM), supported by a suite of open-source tools designed for observational research. These tools include ATLAS, a web-based platform for designing and analyzing studies; HADES, a collection of R packages tailored for observational data analysis from the CDM; and the Data Quality Dashboard, which audits data for quality issues. ACHILLES provides characterization and visualization of CDM databases, while ATHENA enables searching across standardized vocabularies and phenotypes. Tools such as WHITERABBIT assist with data extraction, transformation, and loading (ETL) activities, and USAGI helps map source codes to standard concepts. Comprehensive guidance and documentation are available in The Book of OHDSI.
- Ch. 4: Problem list. Introduced in chapter 2 was the concept of a problem list that appears at the patient level in the EHR. In fact, a persistent problem list that spans encounters/visits is mandated per the Joint Commissions. Researchers need to be aware of difference between the problem list and diagnoses when abstracting data from the EHR. Namely, the problem list is populated based on diagnoses, and therefore follows temporally, and not all diagnoses will need to be captured as ongoing problems. When operationalizing a clinical phenotype, both sources may be consulted.
- Ch. 4: Phenotype repository. Another source of existing phenotypes operationalized from the EHR is the Veteran's Administration CIPHER, short for Centralized Interactive Phenomics Resource.
- Ch. 5: Data linkage. Data linkage needs seem to arise more in the inpatient setting due to the number of electronic systems in a hospital whereas outpatient medicine tends to rely on a single electronic system.
- Ch. 5: Data linkage: unique identifier. In addition to medical record numbers and financial identifiers used to link patients and encounters, requisition numbers and accession numbers are unique identifiers that link patients to laboratory or imaging orders.
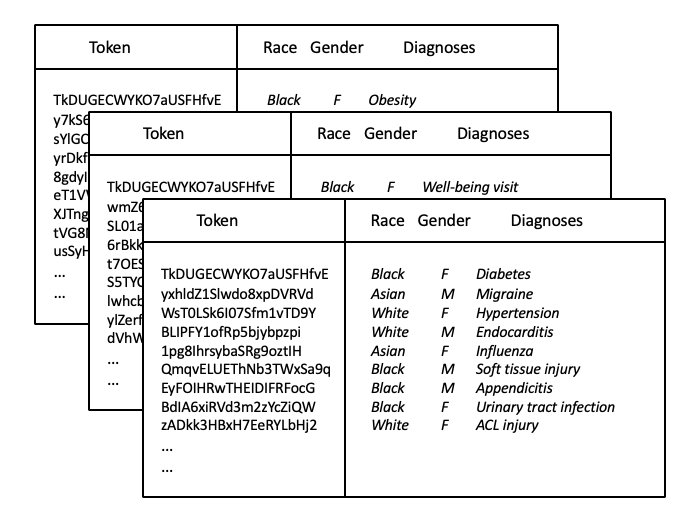
Researchers should also be aware of the relationship between patient identifiers in the EHR. In some EHRs there is a single master Patient ID with a one to many relationship with MRN. For example, if an individual comes into the emergency department unconscious they will be registered with an MRN for that visit. However, it might be the case that this individual was previously a patient in the hospital therefore already had an existing MRN. Once the unconscious patient is identified, a patient reconciliation process will create a record in the master patient index mapping the multiple (valid) MRNs into a single Patient ID. Thus when linking data the top level identifier should be the Patient ID as opposed to the potentially time-varying MRN. However, from the end user/clinician perspective, the MRN is the meaningful patient identifier. Thus if we were undertaking a manual chart review, we would need to work with the patient's MRN and not the master Patient ID in the EHR front end. - Ch. 5: Data linkage: tokenization. Tokenization is a strategy for linking multi-institutional EHRs while ensuring the privacy of individuals within a given system. A token is first produced from the identifiable protected health information that uniquely identifies a given individual in the EHR. Then, the PHI is then removed and the EHR data shared for linkage purposes. Should the token match across the various EHR exports, this uniquely and anonymously has identified the same patient who has seen multiple healthcare systems and their data can be merged. In the figure below that depicts three EHR exports assumed to represent three distinct healthcare practices in a given area, we can see that the token for person #1 is the same and therefore their health information can be merged to create a more holistic view of this patient's health including diagnoses of obesity and diabetes while also including a well-being visit, yet for the other persons their tokens differ, thus likely corresponding to different people who should not be merged. Importantly, the PHI have been removed prior to the data leaving each institution's secure network infrastructure.
- Ch. 6: Missing data on confounders and Ch. 10: Multiple imputation. Confounder data, e.g. comorbidity and symptomology, may be commonly missing in EHR data. Occasionally these data may be present in unstructured encounter notes in the patient's record but are infrequently abstracted do to difficulty in parsing free text (discussed further in chapter 12). When confounder data are missing, even in extensive missingness situations, multiple imputation and propensity score calibration can recover missing data with minimal bias. Propensity score calibration is computationally more efficient. For further details, see Vader et al.
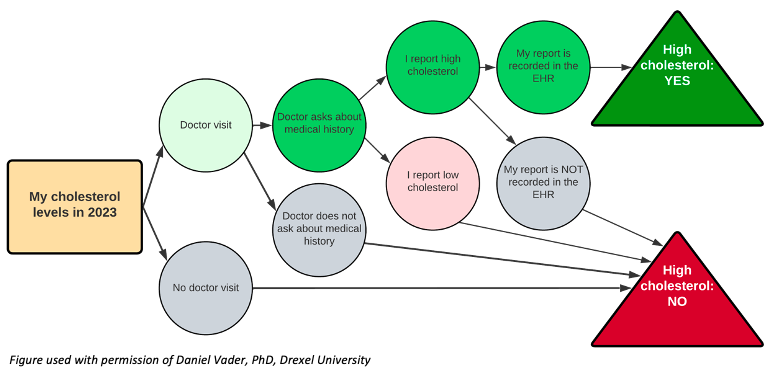
- Ch. 6: Missing data definitions. Missing data defined as MCAR, MAR, or MNAR may not be the most intuitive way to think about missingness in the EHR. Rather, alternate definitions of missing data have been proposed in this context, namely unmeasured, clearly missing, or missing assumed negative. An unmeasured data point is one in which the EHR was never designed to capture, such as firearm ownership, and likely impacts a lot of traditional epidemiologic determinants, as brought up in chapter 3. A clearly missing data point is one in which the EHR was designed to capture, but the values are not present, for example, a patient declining to identify race or ethnicity on their intake questionnaire. The most pernicious of these is the missing assumed negative data point. In this case, the EHR is only capturing the presence of a health condition, not the absence, however, the researcher assumes that lack of documentation indicates lack of a condition. This fallacy is brought up several times in the book and requires the researcher to reflect upon why certain data points are or are not captured, and how we should handle it mechanistically: the decision to discard this variable altogether versus employ a sensitivity analysis if missing assumed negative is an incorrect assumption. Ideally, we would have access to the clinicians capturing these data for clarification, but for previously abstracted data, this may not be possible. To make this more concrete, consider the following figure. Each step of documenting a patient's self-reported high cholesterol is predicating on a decision point wherein the EHR must 1) have a space to record this information, 2) have a provider who asks about high cholesterol and 3) documents it, and 4) can be abstracted for research purposes. (This is related to the iceberg concept of symptom reporting). If there is no documentation of high cholesterol, then we have assumed it is a negative finding, perhaps incorrectly. In short, there are many more steps for a positive finding to wind up in the EHR versus a negative finding, which perhaps suggests why diagnostic codes in the EHR have higher specificity than sensitivity (discussed elsewhere in chapter 6).
- Ch. 6: Catchment definitions and modeling. An older albeit still relevant definition of catchment identified five categories of patient selection forces: availability, accessibility, affordability, accommodation and acceptability. Additional to the distance radii and road and transportation network models of measuring catchment, there are numerous other approaches to defining spatial accessibility of healthcare, summarized by Guagliardo (2004). One of the more popular approaches that focuses on the number of healthcare providers in a given area is known as the two-step floating catchment area. This approach first defines a provider-to-population ratio based on a 30 minute drive time to the centroid of a geographical area, such a a ZIP code. This calculation is repeated for all ZIP codes in a given area, as such there may be overlap of some smaller ZIP codes while larger ZIP codes may have some unserved areas. The second step then sums the ratio measures for a given point, such as the location of the healthcare providers, which forms the measure of spatial accessibility, where the greater the number, the more providers there are relative to the population. Provider data may be freely downloaded in the U.S. via the Centers of Medicare & Medicaid Services' National Plan and Provider Enumeration System: almost all providers in the U.S. are assigned a National Provider Identifier (NPI), a HIPAA mandated identifier for transactions involving PHI. There have been numerous extensions to the two-step floating catchment model, as enumerated McGrail (2012), as well as approaches dealing with temporal changes to catchment.
- Ch. 6: Catchment: representativeness. Chapter 6 discussed how large national surveys can be compared to EHRs to assess representativeness of the EHR. While some studies (cited in the chapter) have observed similar health characteristics between EHRs and national surveys (specifically obesity in NHANES), at least one study noted marked differences between EHRs and BRFSS when reconstructing small area estimates of hypertension, diabetes, obesity, and smoking for the State of Massachusetts. The authors posit case ascertainment is higher in EHRs due to the additional objective biomedical data points and less reliance on potentially biased self-reported health states, as compared to BRFSS.
- Ch. 6: Data quality. A challenge in identifying and discussing issues of data quality in the EHR is lack of a consistent definition of what data quality means. Kahn et al. (2016) reviewed existing literature and conducted interviews with key stakeholders to arrive at consensus definitions. They define three data quality categories: (1) Conformance (2) Completeness and (3) Plausibility and two data quality assessment contexts: (1) Verification and (2) Validation. More detail may be found in Tables 1 and 2 in their paper.
- Ch. 6: Data quality: algorithms to define phenotypes. On the one hand, automating phenotypes via algorithms allows a scale of efficiency and size that is a prime feature of EHR data. On the other, such algorithms can often lead to poor data quality and resultant bias, especially when there is no accompanying validation in a representative sample.
In 2010, Manuel, Rosella, and Stukel cautioned against applying algorithmically-driven disease definitions to the EHR population. By algorithmically-driven, they refer to an automated computerized approach to phenotyping without manual review. They note how doing so often leads to misclassification as compared to a manual curation of an EHR research dataset where individual patient records are reviewed by experts. Yet the authors recognize that it is uncommon -- and perhaps unrealistic -- to individually verify patients in the EHR research dataset, and thus present common sense steps for researchers to follow when creating EHR-based samples where diseases status is algorithmically defined (see Box in Manuel et al.). Essentially their steps recapitulate present day good practices when working with EHR data: carefully define the phenotype, assess for possible misclassification, compare against a known reference standard, and conduct a quantitative bias analysis.
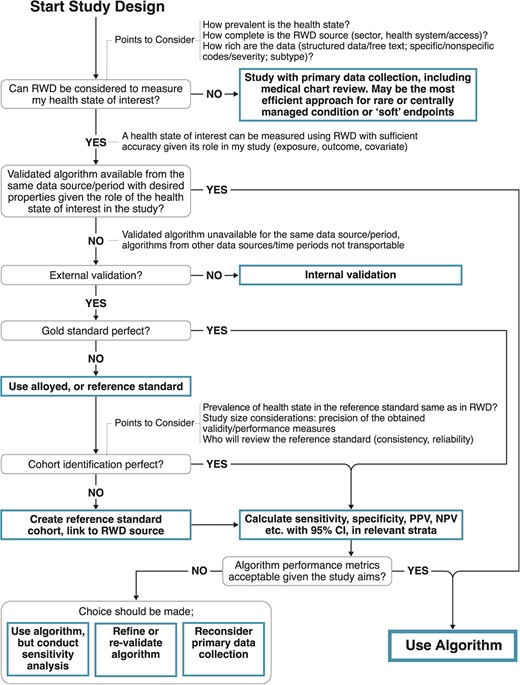
More recently, Ehrenstein et al. discussed the importance of validating phenotypic algorithms for EHR data and provided a concise overview of creating and measuring the performance of such algorithms. Their definition of an algorithm includes any computerized process that identifies a patient with some health state or condition: this could be as simple as an ICD code or as complex as a syndrome of conditions defined by multiple data points (e.g., labs, imaging, medications) from multiple systems (e.g., laboratory, radiology, pharmacy). The algorithm is the process by which the clinical phenotype gets created. They proceed to identify criteria for gold or referent (alloyed) standards based on chart review while also noting that true gold standards in EHR-based research are uncommon, followed by a discussion of measures of accuracy that may be calculated from a validation study. Interestingly, they observe that it is common in the literature to have measures that positively identify a health state (i.e., sensitivity or positive predictive values) while measures that capture absence of a health state (i.e., specificity or negative predictive values) are rarer in EHR research because of the effort required to validate negative documentation. From a pragmatic standpoint they note that which measures to prioritize in a validation study depend on the goal of the algorithm: vis a viz. identification of eligibility criteria for a real-world evidence study, treatment exposure, outcome assessment, or confounder identification. However, if the researchers deem it worthwhile to undertake a validation study, all measures of accuracy should be calculated when practical to enable future quantitative bias analysis. Figure 2 in Ehrenstein et al., reprinted below, proposes a decision tree for the appropriate use and validation of a algorithmically-defined phenotypes in EHR-based research. (Source: https://pubmed.ncbi.nlm.nih.gov/38754870/) - Ch. 6: Data accuracy in inpatient medicine. It is also worth noting that in many studies inpatient diagnoses are more reliable than outpatient diagnoses (Segal & Powe, 2004, Lynch et al., 2021, Garza et al., 2021, Kern et al., 2015). This may be related to the importance of accurate codes for reimbursement in the inpatient setting. When using outpatient codes to operationalize a phenotype, investigators may consider requiring multiple (>1) occurrences of a particular code to define a positive finding. Another approach for improving accuracy of the outpatient phenotype is to mine information generated from specialty care referrals, if available. Researchers in the U.K. have demonstrated how post-consultation letters written by the speciality care provider may be mined using natural language processing (see chapter 12) to identify cases of psoriatic arthritis not otherwise not documented in the outpatient EHR.
- Ch. 6: Data accuracy in outpatient medicine. A study involving patient review of ambulatory care notes found an observed 20% reported error rate in the EHR among respondents, with over 50% labeling these errors as "serious" or "very serious." Among the very serious errors, patients most commonly reported a mistake in past or current diagnoses (28%), followed by medical history (24%), medications or allergies (14%), and tests or procedures (8%). Several patients even suggested that the notes were ascribed to the wrong patient (7%). Errors tended to be reported more commonly older and sicker individuals. The 20% overall error rates observed in this study has been corroborated by other surveys, which also note that a majority of self-reported errors in the EHR are found in outpatient practices. Motivated by studies such as these has prompted Bell et al. (2022) to develop a framework for categorizing patient-reported breakdowns in the diagnosis process during ambulatory care. This framework can be used by EHR researchers as an aid to conceptualize data in the EHR and its potential impact study validity, especially among those working with outpatient EHRs. As part of this framework, Bell et al. described the mediating role of patient engagement between the healthcare provider and improved EHR data quality, represented in their Figure 2.
- Ch. 6: Data accuracy: status of code. As mentioned in chapter 6, false positive diagnoses in the abstracted data are possible if we fail to account for "rule out" codes and the condition is subsequently not diagnosed. There are other possible code modifiers in the EHR that researchers should be aware of. For example, diagnostic codes may have a status of "possible," "suspected," or "probable" and laboratory orders may carry a status of "pending," "preliminary," "final," or "corrected." The decision how to handle these is a trade off between sensitivity and specificity of a given diagnosis or measurement in the EHR.
- Ch. 6: Data accuracy: specificity. As discussed in this chapter, it is well known that for ICD codes, sensitivity << specificity. However, even near perfect specificity can still substantially bias. In an exploration of non-differential exposure misclassification of pediatric inflammatory bowel disease (IBD), the authors found that the impact on the relative risk between IBD and cancer was greatest for small reductions in near-perfect specificity as opposed to larger reductions in sensitivity. In general, when designing a study from the EHR and the outcome is prone to misclassification (as in a case-control study using ICD codes), specificity should be prioritized over sensitivity. Fortunately, the nature of ICD codes as documented in the EHR naturally prioritizes this trade-off between sensitivity and specificity.
- Ch. 6: Duplicate data. Chapter 5 discussed how duplicate observations can be an artifact of the data abstraction and management process. Duplication observations also exist in the EHR itself. This can occur via the patient registration process whereby a patient identifier (e.g., name, date of birth, MRN) fails to map to an existing record, for example, due to a typo. Some have estimated that over 20% of records may be duplicates in certain hospitals or healthcare systems. Patient reconciliation and de-duplication is a core function of EHRs. Aside from potential for patient harm, for researchers failure to identify duplicate records results in an artificial correlation among observations and must be handled statistically lest the standard errors be biased.
This chapter also mentioned how use of templates and macros allow for clinicians to quickly enter information into the EHR. Aside from potential inaccuracies that result from this, there also may be duplicate data in the patient record. One study found that >50% of clinical notes were duplicates, suggesting that copying and pasting previous entries is a common occurrence. This may further exacerbate some of the data quality issues: the duplicate notes provide no new information, may provide a fall sense of security on a diagnosis, potentially exacerbating data quality issues that threaten study validity. - Ch. 6: Data completeness: mortality. Studies that involve mortality as an end point have an additional complication when relying on EHR data. The fragmentation of healthcare may result in the absence of a death indicator in the EHR. This could be because the patient expired at another healthcare system, or was not in a healthcare setting at the time of death. While this information is recorded in vital statistics, which is the function of State governments (in the U.S.), there may not be interoperability between EHRs as these government systems. The National Death Index, often considered the most complete source for mortality information in the U.S., also suffers from a time lag between death and propagation into linked systems. One study conducted among cancer clinics reporting data to Flatiron Health observed a sensitivity between 54-71% for the presence of mortality data in a discrete field in the EHR; in other words, data are missing between 29-46% of the time. This can be improved when incorporating unstructured EHR data combined with externally linked data. On the other hand, presence of a death indicator may also be subject to misclassification, especially when relying on reason for death. The Rethinking Clinical Trials e-Book contains further information on challenges associated with measured death in real world data. More recently, investigators have demonstrated how publicly available websites, such as Obituary.com/TributeArchive.com, may be used to supplement missing or validate existing EHR mortality data. Using public records has the added advantage of being updated at near-real time with no cost to access.
- Ch. 6: The medical narrative. In 1991, Kathryn Montgomery Hunter published what is arguably the most important ethnographic study of how clinicians approach the art of medicine, interpret patient stories, and create the corresponding medical narrative. Although this study was conducted prior to widespread use of EHRs, the findings reveal the many nuances and subtleties of the clinical documentation process. The book contains numerous eloquent passages that are applicable to the modern day EHR researcher. Hunter writes "every patient is the object of a highly abbreviated and written-to-the-moment entry in an office or hospital chart" (p83). The EHR is a snapshot of medical care delivered to a specific patient at a specific time, and no more. It is a brief window of time into the lifecourse of this patient. In Hunter's words, the chart is a "record of each patients medical course, observed in one or more office visits or, in the hospital, from entry to discharge" (p84). The chart is a "minimalist account" (p91), "the chronicle of an individual's physical condition while under medical care [...] governed by the determination of a diagnosis and the selection of a treatment" (p87). As has been argued in this book, the EHR is not a substitute for a survey of epidemiological relevant factors and determinants of etiology: those must be obtained via data linkage or prospective study. As Hunter explores deeper meaning of the medical narrative, we can appreciate the heterogeneity of the type and quality of documentation in the patient's chart. For example, there are differences in the documentation between outpatient and inpatient medicine. Hunter observes that in the outpatient setting "the chart is a collection of private notes" (p84, emphasis added) whereas in an inpatient setting "it has at least a small audience of those who are its several authors." In other words, we tend to see more detail in the inpatient setting to avoid miscommunication of greater acuity patients. When multiple clinicians are involved in care, the chart becomes more objective and less subjective (p87). However, this is not to say that inpatient notes are uniformly superior to outpatient notes as more entries in the longitudinal record, with correspondingly greater detail, may also create more uncertainty due to potentially conflicting information or tests results, resulting in a "cascade of uncertainty" (p88). When such discrepancies arise, Hunter suggests that notes recorded by consulting specialists are likely the most authoritative, followed by attending physicians, and then residents and trainees (p89). In general, we can also observe in the EHR that more complicated, sicker, or "interesting" patients have more detail in the charts (p91-92). This is related to the notion of informed presence bias discussed in chapter 9. This heterogeneity in narrative detail can also be driven by clinician experience, as Hunter notes that detail is inversely proportional to years in the profession: more junior clinicians document more detail. However, as a whole, "concise notes are more highly valued than long ones" (p85), which has implications for the ability to parse the medical narrative and infer or impute epidemiological determinants that are not discretely coded. This is especially true under the EHR paradigm where traditional narratives are disincentivized (by payors) in favor of coded and discrete documentation using standardized templates. The transition to EHRs and its impact on the clinical encounter is further discussed in a review by Hedian, Greene, and Niessen (2018).
- Ch. 6: Upcoding and downcoding. The practice of upcoding, or overbilling for diagnoses and services not provided, was introduced in chapter 6. In reality, downcoding, or underbilling, may be more common in the EHR to avoid potential for fines.
- Ch. 6: Aggregated EHR data. There are unique issues that occur when EHR data are aggregated across disparate healthcare systems beyond the general - and more well known - concerns about secondary analysis of EHR data from a single entity described in this chapter. These challenges include 1) loss of information during data aggregation, 2) masking heterogeneity and correlated errors when the source EHR is unknown, 3) exacerbation of the traditional threats to validity during EHR research, and 4) statistical overpowering of hypothesis tests. An overview of using these aggregated data in research was provided by Olaker et al. (2024).
Section II, Epidemiology and Data Analysis: Chapters 7-12.
- Ch. 7: Cohort study design. Williams (2021) described in detail the process of creating a retrospective cohort from the EHR. Central to the discussion was identification the baseline visit of the patient. As EHRs are considered open cohorts, data may be left censored prior to the patient seeking health care. To establish a "wash in" period, one may wish to delay baseline assessment until a patient has been in a given EHR for a period of time or has a minimum number of encounters. Recruiting from a primary care practice, if available, may enable a more complete assessment of a patient's baseline characteristics due to the continuity of care in an institutional EHR setting. However, certain biases may be introduced by an overly restrictive selection schema including informed presence bias and selection bias, discussed elsewhere in the book. The use of the target trial framework (see chapter 12) can help EHR researchers reflect on cohort study design considerations such as eligibility criteria and follow-up period.
This is also related to the concept of a "lookback" period (may also be termed "look back", "wash-in", "run-in", "drug free", etc. depending on research area) for assessing eligibility criteria, defining baseline exposure, or measuring follow-up and outcome. In other words, how far back in time should one examine in the EHR for assessing some characteristic. As has been argued, administrative data are subject to limitations on data availability and accessibility. For example, EHR data that are purchased or licensed (especially from multi-institutional data) may not have the longitudinal granularity that EHR data obtained from a single institution. This in turn would impact decisions researchers might make about lookback periods. A scoping review from 2025 compares a variety of lookback periods across EHR, claims, and registry-based studies from a broad geographic sample. While there is no optimal lookback period, researchers may wish to consult this review for guidance in the event that their study question aligns with one of the included examples. - Ch. 7: Case-control study design. Despite the elegance and efficiency of the case-control study design, these study designs are not without controversy in EHR research. Schuemie et al. (2019) argue against using case-control studies in retrospective databases, such as the EHR, due to the appropriateness of comparison groups, the timing of when covariates are captured relative to exposure (thereby inappropriately adjusting for possible mediators), and lower statistical power. Instead the authors argue that retrospective cohort studies may be more appropriate when data on exposure and covariates are present in the EHR. When a case-control study is undertaken, negative controls (a condition unrelated to the one under study) may provide a sense of possible bias. On the other hand, one can consider a nested case-control study design/quasi-cohort approach or the incident user study design, as a way forward. Importantly, we should note that 1) there is nothing inherently flawed in the case-control study design, and 2) conceiving of the EHR as an open cohort allows for flexibility in the hybrid case-control designs since we sample directly from the study base. A brief discussion on control selection from EHRs including strengths and weaknesses may be found in Banack et al. (2024) and an overview of matching in case-control studies has been provided by Iwagami & Shinozaki (2022).
- Ch. 7: Modeling sample size. A common use of EHR data in a clinical setting is to build a model that may predict clinical outcomes, such as mortality or hospital readmission. In general, these models should be constructed with as large of sample size as reasonable, but at a minimum there should be 10 events per predictor. More guidance on calculating sample size for predictive modeling using EHR data may be found in Riley et al. (2020).
- Ch. 8: Measuring prevalence and incidence in the EHR. Chapter 8 defined the concepts of prevalence and incidence. These common measures may vary in their estimates and interpretation depending on assumptions about the EHR population composition at a given time. This is detailed in Rassen et al. (2018). In short because the EHR is an open cohort with left and right censoring, the patient-time observable to researchers can vary. Different design choices can impact the numerator (for prevalence) and denominator (for prevalence and incidence).
- Ch. 8: Immortal time bias. Chapter 8 introduced the concept of immortal time bias and how knowledge of treatment initiation and duration is needed for unbiased estimates. This information is rarely captured in the EHR, and thus we have to make assumptions about both. A technique known as clone-censored weighting can address this bias. by emulating an RCT with full adherence. The three step process involves 1) cloning individuals to all treatment strategies, 2) censoring the clones when they deviate from their assigned strategy, and 3) using inverse probability of censor weightings to reconstruct the pseudo-population as if there was no censoring. This is more fully described conceptually in Hernan (2018).
- Ch. 9: Confounding by indication. Confounding by indication and protopathic bias can more readily be appreciated through the use of causal diagrams (below figure).
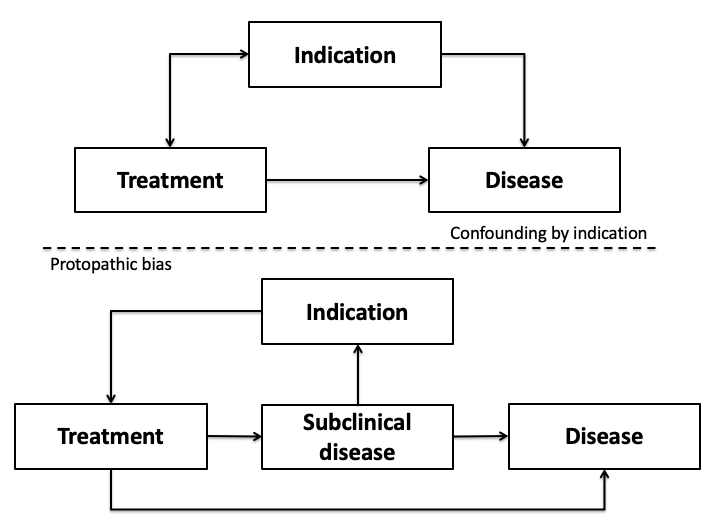
Confounding by indication appears as a traditional confounder, for example, on the basis of the unmeasured covariate patient prognosis. On the other hand, protopathic bias appears more closely aligned to the issue of reverse causality in that the disease itself - more specifically a preclinical or subclinical state - influences the likelihood of treatment which then may subsequently impact the outcome. - Ch. 9: Informed presence bias. Zhang et al. present a quantitative bias analysis approach for assessing the impact of informed presence bias when it manifests as a misclassification bias. Vader et al. present a framework and analytic approach using generalizing estimating equations inverse intensity weighting (a weighting procedure that assigns a probability to an observation being observed) to deal with informed-presence bias in EHR-based studies. One group of researchers has posited that adding an interaction term between treatment and time (specifically, first year of follow-up) may remove informed presence bias due to differential healthcare utilization.
- Ch. 9: Sampling error and selection bias in EHR research. Weiskopf et al. (2023) provided an approachable introduction to selection bias in the context of epidemiological analysis of EHR data. Their examples are based on a traditional etiologic study (exposure->outcome) illustrated via directed acyclic graphs (DAGs). They demonstrate how selection forces acting upon patient access to healthcare, or a corollary of healthcare access, can induce selection bias when conducting a retrospective analysis from the EHR. First, as argued in chapter 6, there is a need to understand the catchment of the healthcare system and selection forces at play from the source population. This can be presented via table 0 (described in chapter 10; see below). As Weiskopf et al. posit, a closed healthcare system -- one where there is a lack of competition -- may be less subject to a non-representative sample because patients may lack options. Similarly, depending on the health condition under study, for example a rare or hard to treat condition, there may be less competition and thus fewer options for patients to select. Agent based models are potentially useful to identify factors that relate to selection bias in EHR-based research. Second, selection forces may impact estimates beyond an etiological study. Consider a health department trying to estimate the prevalence of a disease in their jurisdiction from an EHR. The estimate for prevalence may be biased if the EHR is not a random sample from the source population. Epidemiologists would refer to this as a sampling error as opposed to a selection bias, and can be viewed as a threat to external validity. The estimate is valid in the context of the EHR but is not valid in terms of the population targeted for inference. Thus the target population of the EHR research is important to define as part of this discussion: to whom do the study results apply? Weighting the patients by their likelihood of sampling into the EHR (i.e., conceptualizing the EHR as a complex survey from the source population) can help adjust the estimate as if a random sample from the population had occurred. This has been demonstrated for estimating HIV viral load for a population from a single EHR using what is known as post-stratification weights. The challenge in this post-stratification weighting is to identify and measure the characteristics related to catchment. Lastly, although Weiskopf et al. advocate for remediating selection bias in the context of the study design, it is not always possible to do so when relying on a retrospective cohort of EHR patients. One can turn to quantitative bias analysis (discussed elsewhere in chapter 9) to understand the impact of the hypothesized bias by estimating selection probabilities. Marginal structural models that employ inverse probability weighting are one methodological approach to countering the effect of a selection bias in EHR research: this has been previously demonstrated in estimating the effect of neighborhood deprivation on chronic infection with hepatitis C virus. Similarly to the HIV viral load weighting example described earlier, the utility of these methods depends on being able to define the catchment process via a statistical weighting model. For a further discussion of the differences between post-stratification weights and inverse probability weighting see Goldstein et al. (2024). Another example of post-stratification weighting, including a good overview of the method, may be found in the linked study. Aggregated EHR data, such as the NIH's All of Us research program, may exacerbate issues of sampling error and selection bias (see above); researchers have demonstrated how weighting techniques may be used in All of Us to yield more generalizable prevalence estimates, although such techniques may not be able to fully account for non-representativeness.
- Ch. 9: Bias assessment in EHR research. The identification of validity threats in EHR research may be aided by published bias assessment tools, such as the APpraisal of Potential for bias in ReAl world evIdence StudiEs (APPRAISE) tool. This tool covers key domains where bias may be induced in EHR research: inappropriate study design and analysis, exposure and outcome misclassification, and confounding. While the APPRAISE tool was developed in the context comparative effectiveness research from the EHR, the same threats to validity pervade all EHR research.
- Ch. 10: Describing the selection process. In addition to a traditional "table one" that describes the study population, researchers may also consider including a "table zero" that details the underlying clinical database the EHR data were derived from including the selection process. This not only aids in transparency and openness of science, it will allow an evaluation of potential sampling or selection biases. Regardless, a well constructed "table one" will include details on the target of inference along with a comparison to the study sample or population.
- Ch. 10: Exploratory analysis of missing data. For users of R seeking a more automated approach to dealing with missing data in the EHR, the package "Structural Missing Data Investigations (SMDI)" provides a toolkit of descriptive functions and diagnostic tests. A description of the package may be found in Weberpals et al. (2024) with applied examples assessing missingness on confounder variables in the EHR found in Weberpals et al. (2024) and Raman et al. (2024).
- Ch. 11: Negative controls. Negative controls have been used in an EHR setting to deal with the confounding and selection bias forces of health seeking behavior. As is well known and argued in chapter 6, individuals who seek healthcare are fundamentally different from those who do not. If we are conducting an EHR-based study with the target of inference beyond the bounds of the EHR, for example, evaluating the effectiveness of vaccine, but we are limited to EHR data, we must methodologically deal with this potential threat to validity. Researchers have used negative controls, specifically two models - a negative exposure control and a negative outcome control - to remediate the bias. A negative exposure control seeks to identify an exposure that is not associated with the outcome but is associated with health seeking behavior, and a negative outcome control seeks to identify an outcome that is not associated with the exposure but is also associated with the health seeking behavior. Then, a two step regression is used to estimate the desired causal effect. For example, another vaccine may serve as a negative exposure control since its clinical effect will be limited to its antigens, while another disease may serve as a negative outcome control since its cause will be unrelated to the vaccine under study. However, both receipt of another vaccine and diagnosis of another disease relate to health seeking behavior, thereby "balancing" the groups.
- Ch. 11: Causal inference. Chapter 11 briefly discusses causal inference considerations. For those conducting etiological EHR-based research under the potential outcomes framework, an excellent overview of statistical estimands - e.g., average treatment effect - may be found in Griefer & Stuart (2023).
- Ch. 11: Cohort with correlated observations. Chapter 11 includes analytic strategies to use when a cohort study includes correlated observations. Multi-level (hierarchical) data are common when examining patterns of health care or outcomes between patient rooms, hospital departments, or even hospitals themselves. In the simplest sense, patients may be nested within one of these clustering units and that clustering unit does not change. However, this simplification does not match the reality of patient care. For example, patients may be transferred between rooms, departments, or hospitals. Patients may also have multiple (distinct) hospitalizations at different hospitals but within the same geographic area. Thus, a single clustering unit restricts this movement, usually to the room, department, or hospital with the longest time. On the other hand, researchers are more commonly using cross-classified multilevel models to allow for time-varying cluster units. For example, Schnake-Mahl et al. (2025) explored how hospital and neighborhood variability predicted COVID-19 mortality and found more variation across hospitals than across neighborhoods. Webster et al. (2025) demonstrated the use of cross-classified models for identifying risk factors for C. diff infection from patient transfers during inpatient hospitalization.
- Ch. 11: Discrete-time survival analysis. Chapter 11 introduced the Cox proportional hazard model for estimating time-to-event analyses using EHR data. This model assumes the outcome risk period is continuously measured during follow-up, such that the event, when it occurs, is known with certainty. This may be appropriate when there is a continuous follow-up period for the cohort, but in many electronic health record-based studies, individuals will not be continuously engaged with healthcare. Rather, they will seek healthcare at some interval. The idea of only collecting outcomes at each interval is an example of a discrete-time survival model, also called pooled logistic regression modeling or person-period modeling. The fundamental concept is that risk is modeled according to some interval. For example, suppose we were interested in following individuals on highly active antiretroviral therapy in an HIV clinic for assessing virologic failure. In this scenario, individuals have their viral load measured quarterly, thus for each active patient in this clinic, we will have quarterly measurements of their viral load. The calendar year quarter can be thought of as the person-period or the discrete time being modeled. We cannot say when during this quarter the virologic failure occurred - in other words, we lack the continuous data inherent in a traditional time-to-event survival analysis - but rather just the quarter the event occurred. In this case we can perform discrete-time survival analysis via a pooled logistic regression model. These models may be fit with one of two link functions - logit or complementary log-log - where estimates are on the odds ratio scale of the hazard ratio scale, respectively. When the event is rare in that period, the odds ratio will approximate the hazard ratio. An overview of discrete-time modeling may be found in Suresh, Severn, and Ghosh (2022).
One important implementation detail for these models is the need to transform the data from wide to long format. Each patient will a unique row corresponding to the number of intervals they were under observation, until either the event occurred or they were censored. Unlike in longitudinal modeling, there is no random intercept or clustered error in the pooled logistic model.
As an example of discrete-time survival, Harris et al. (2024) used nursing home EHR data to model the association between the discontinuation of antipsychotic medications (exposure) and new trazodone use (the outcome). The EHR data were available as an administrative database where medication measurements were only available quarterly. Because of the quarterly nature of the medication measurements, a discrete time survival analysis using the complementary log-log link function was needed to estimate the hazard ratio. The authors observed that over follow-up, residents who discontinued antipsychotics had 1.8 times the rate of trazodone initiation (adjusted hazard ratio 1.82, 95% CI 1.66-2.00) compared to residents who continued antipsychotic medications. - Ch. 12: Emulating clinical trials. Chapter 12 presented the target trial framework for EHR research. Under this framework, an idealized clinical trial is mapped from the available EHR data. In theory using a prescriptive and rigorous approach to observational study design should strengthen the quality of EHR-based observational research and causal inference. In practice, researchers have been challenged by the ability to replicate clinical trial results using EHR data. See, for example Merola et al. (2024) and Bartlett et al. (2019). Ren et al. (2026) conducted a systematic review and noted wide variation in the implementation and adherence to the framework. For example, in few papers reviewed was a target trial protocol even developed and pre-registered, and there were many deviations from the prescribed seven core features of the framework. The authors noted "inappropriate use of postbaseline information for eligibility, inadequate description or implementation of procedures intended to emulate randomization, inconsistent specification of time zero, [a failure to assess] the influence of unmeasured confounding, and [lack of] visual diagrams to clarify follow-up design." The authors provided recommendations to improve the practice of using the target trial framework that are applicable to EHR research. Adherence to the TARGET guideline (Transparent Reporting of Observational Studies Emulating a Target Trial) when publishing trial emulation studies may improve the transparency and quality of these studies.
Related to this topic, Rafalko, Gianfrancesco, and Goldstein (2025) discuss how natural language processing (discussed elsewhere in chapter 12) can be used to augment the information available to EHR researchers when performing target trial emulation. They explain how discrete, coded EHR data may be insufficient to successfully operationalize the seven core features of the target trial, and how NLP can supplement the available information. - Ch. 12: Machine learning and modeling. For readers interested in an overview of deep learning and neural networks, this article describes their application to predictive modeling of health data, including the EHR.
- Ch. 12: Machine learning, modeling, and confounding. An important part of causal ML modeling is confounder identification. Benasseur et al. (2022) reported successful results on the use of several ML algorithms to identify known confounders in complex EHR datasets, and when confounders were hidden (i.e., unknown to the algorithm), identify proxies to reduce residual confounding. For researchers interested in delving further into confounder identification and adjustment methodologies using EHR data, one can create "plasmode" simulations from empirical EHR data to compare variable selection strategies.
- Ch. 12: Machine learning and algorithmic bias. This problem was alluded to in chapter 12, under the machine learning discussion. More specifically, algorithmic bias occurs when disparities in healthcare and health seeking behavior are propagated in research from the EHR. There are several strategies researchers have employed to guard against this type of bias. Grant et al. included relevant stakeholders in their approach, addressed missing data, and validated the model in the target population with representation of underserved groups. Mazurenko et al. performed subgroup analyses and explored for heterogeneity of effects by these subgroups instead of simply adjusting for them.
- Ch. 12: Machine learning and reporting. The TRIPOD guidelines have been proposed as a way to standardize reporting of ML predictive models applicable to EHR-based studies.
- Ch. 12: Natural language processing. It is worth noting that there is a spectrum of NLP implementation. That is, one may not need to deploy a full solution that automatically discretizes the textual data. Rather NLP can be used to retrieve "snippets" of text that a researcher manual reviews for the final determination. By analogy, NLP is more of a decision support tool than a diagnostic tool. The efficiency of the investigator team to classify these snippets will be influenced by the quantity of manually data to review, in which case some error may be acceptable at the cost of time or resources. One important challenge in NLP applications in the EHR as a data source is the frequency of misspellings and grammatical errors as compared to other free text data sources. A simple string matching approach may fail to recognize terms that are commonly misspelled.
At the other end of the spectrum, the use of large language models (LLMs) is considered the state-of-the-art in NLP. An example of a LLM applied to the EHR is this study to identify medication discontinuation in the EHR as discontinuation events may be captured in unstructured free text as opposed to a discrete element. LLMs are computationally intensive and require significant resources to build, test, and maintain these systems. The majority of clinical NLP applications use rule-based approaches that are simpler to implement. Over time, it is expected that the LLMs will become more user friendly; one study has demonstrated that "out of the box" implementations of LLMs may perform satisfactorily for clinical NLP without the need for fine tuning. However, the quality of the prompt to the LLMs determines the quality of the output thus there is still a need for testing and refinement.
Lastly, to provide a sense of the staggering volume of clinical notes that may be encountered in the medical record, we can turn to a study done in the Penn Medicine Health System between January 1, 2015 through December 31, 2020. Researchers examined the entire corpus of clinical notes in the EHR, for all types of notes, from all clinical contexts, and included author types from all adult patient encounters. The corpus consisted of 104,456,653 notes for 1,960,689 unique patients, including 32,991,489,889 words or 192,618,267,371 characters of text. On average there were 53 notes per patient. A break down by provider and note type may be found in their supplemental material. - Ch. 12: EMERSE: Electronic Medical Record Search Engine. EMERSE is another EHR-specific free text processing engine. EMERSE is a fully developed, open source, EHR-agnostic information retrieval engine that processes medical records to identify terms and concepts in free text. While the authors claim it is similar to NLP, one of the key features is its purported ease of use, and that is implied in the over 500 publications that have used this tool. One possible workflow for the researcher would be to identify patients in the EHR comprising a study population (see chapter 7), retrieve relevant data for those patients (using one of the approaches described in chapter 4), and have EMERSE abstract terms and concepts from the free text in that data extract. Although the software is freely available, users will need to request access to the program. There are many other software options for clinical NLP, including open source options such as CLEVER, cTAKES, and MedCAT/CogStack NLP. A comprehensive list of NLP software used for clinical information extraction as of 2018 may be found in Table 2 in Wang et al.
- Ch. 12: Multiverse analysis. When modeling decisions are suspected to meaningfully alter findings, a multiverse analysis may be warranted. Multiverse analysis seeks to quantify the extent of uncertainty - i.e., variability - that would not be captured in a single analysis, akin to meta-analysis but within a single dataset. As compared to traditional sensitivity analyses, which focus on a select few pre-specified robustness checks, multiverse analyses represent a more comprehensive suite of modeling decisions: i.e., the multiverse of possibilities. Such analyses may include hundreds or thousands of possible permutations, with a resulting posterior distribution of effect estimates in the millions.
Multiverse analysis involves pre-planned parameter choices across the entire spectrum of research activities: study design choices, data management decisions, and analytic and modeling procedures. It may be considered more of an exploratory tool than an etiologic tool, although when models are robust to modeling decisions, especially with regard to the direction or magnitude of estimates, it provides information as to the likely causal relation. Nevertheless, the quality of inference is not improved simply by conducting more analyses: each individual analysis in the multiverse is subject to the same limitations inherent in observational EHR research. A tutorial on multiverse analysis with accompanying R package may be found in Gotz, Sarma, and O'Boyle (2024).
Ferguson et al. conducted a multiverse analysis using EHR data for the effect of statin use on Alzheimer's disease and related dementias. The decision as to which modeling specifications to vary followed the target trial framework, and primarily focused on study eligibility criteria, definition of the outcome, and covariate sets used for adjustment. Their multiverse resulted in over 1.2 million effect estimates. Findings reflected which variables were most influential in the causal effect estimates and also demonstrated qualitatively different results depending on modeling decisions.
Section III, Interpretation to Application: Chapters 13-15.
- Ch. 13: Releasing EHR data. In addition to releasing source code under the open epidemiology paradigm, researchers may also consider releasing the study data. This can be required by federally funded research but is always a worthwhile endeavor. However, since EHR data frequently contain protected health information (see chapter 3), whether in discrete fields or in free text, they cannot be released without de-identification and an assurance of protecting the patients' privacy. Fortunately, technological solutions exist to this problem. A synthetic population can be created with the same characteristics of the EHR extract while preserving the correlations across the measured variables. For a description and example of how to use the R statistical platform to create a synthetic population, see Major-Smith et al. (2024). A potential downside to this strategy is the synthetic data should not be used for new and original research questions, but rather for reproducibilty and transparency reasons. It may also be possible to remove or scramble the PHI prior to releasing the data, as in the case with the publicly available Medical Information Mart for Intensive Care (MIMIC) dataset. In this case, the data are real, not synthetic, yet wholly unidentifiable. As opposed to synthetic data, these data can be used for original and new research purposes. Regardless of the strategy, researchers should consult with the governing institutional review board to ensure compliance with local policies. Extra care is required for de-identifying free text notes.
- Ch. 14: Learning health system. Under the learning health system paradigm, technology, clinical practice, and research form a continuum to systematically refine and improve care delivery while reducing costs. EHRs are a key component of this. First, EHR-derived data are used to generate the evidence-base through analysis. Second, the EHR itself can be modified to help apply the evidence into practice. (Source: https://pubmed.ncbi.nlm.nih.gov/31245583/)
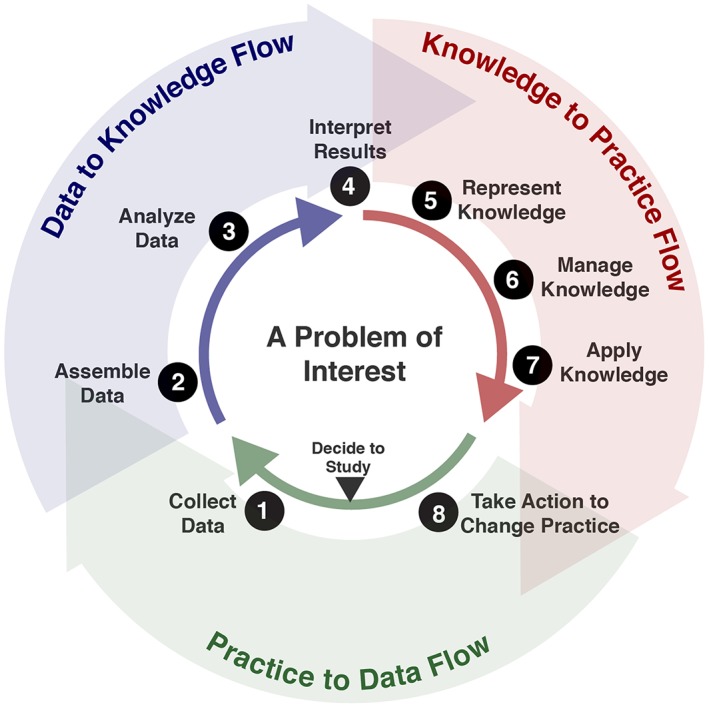
Post, Burningham, and Halwani (2022) provided a review of challenges and opportunities for using EHR data in the learning health system model. Although their review was specific to oncology, it is applicable to other clinical domains. Notable limitations identified in their review include lack of interoperability, need for population (as opposed to individual) real-time reporting, poor data quality, and difficulty in obtaining and operationalizing research datasets from the EHR. This book has addressed many of these issues at length. The authors proceed to identify both clinical and research opportunities to use the EHR in the learning health system. These opportunities included real-time data flow from EHRs combined with the latest evidence based guidelines for clinical decision making, interoperability between EHRs and 3rd party applications, increased use of machine learning to aid in prediction models and communication interfaces (e.g., speech recognition), improved clinical trial recruitment, and seamless reporting to external health registries and partners. This last point in fact motivated a research group from Wake Forest University (Winston Salem, NC) to create a diabetes disease registry from their EHR to enable the learning health system model. In their article, the authors discuss the difficulty in operationalizing a diabetes phenotype from the EHR, creating research databases, and integrating with population health systems. In addressing these challenges, the authors present an approach to the creation of a registry from the EHR using open source tools and a common data model. This is but one example of using EHR data for the learning health system: the U.S. Agency for Healthcare Research and Quality maintains a list of case studies on their website that detail how several healthcare systems have approached this complex task. Lastly, the learning healthcare system does not have to rely on institutional EHR data, rather it can utilize the shared experiences of external health systems, for example, through analysis of aggregated non-institutional EHR data. Aggregated non-institutional EHR data are discussed in chapter 4.