Social Network Analysis in Epidemiology: Part 2
A prerequisite to modeling social networks is familiarity with the terms and concepts used in the field. This glossary is based on two sources: 1) Network modeling for epidemics workshop at the University of Washington (2015), and 2) Borgatti, Everett, Johnson (2013): Analyzing Social Networks.

Networks as applicable to public health are essentially comprised of two objects: people and the relationships between the people. These relationships may be sexual, emotional, transactional, and so on. In social network science, people and their relationships are referred to as follows:
- People. Known as a node, an actor or a vertex. Represents the unit of analysis in the network. The number of nodes involved is identified by the terms individual (one), dyad (two), triad (three).
- When the nodes are all of a single type, the data are said to be one-mode. When the nodes can be one of two types (e.g., students and classes) the data are two-mode. If the modes of the same type cannot mix (have a relationship) then the graph is bipartite (e.g., a purely heterosexual network).
- Nodes may have specific attributes, such as gender, age, occupation, and risk factors for outcome. These are akin to covariates in epidemiological analyses.
- Relationships. Known as edges, ties, or adjacencies. Defines a connection between nodes in the network. These relationships may be:
- Directed. For a person A and a person B, a directed relationship implies that A acts on B, but that B does not act on A (e.g., a business transaction such as loaning money).
- Undirected. If A acts on B then B also acts on A (this is known as reciprocity or symmetry, e.g., sexual networks in which we ignore gender or position roles).
- Independent. When the probability of a relationship is independent of other relationships (aka dyadic independence).
- Dependent. When probability of a relationship is dependent on other relationships. This is akin to friends of a friend becoming friends (aka dyadic dependence).
A key question we want to address in social networks is how do relationships form? Selection is the process by which actors choose each other, and may be based on some shared characteristic (termed homophily; "birds of a feather flock together"). On the other hand, friends of friends may become friends, known as transitivity (for person A, B, and C there will be an edge connecting A—B, A—C, and B—C). In both cases of homophily and transitivity, triangles in the networks may be formed (A, B, and C all have an edge so they are fully connected), but fortunately can be disentangled statistically. Selection may also occur within subgroups or clustering and represent cliques or factions.
We can describe number of relationships in a social network by using measures that reflect cohesion:
- Connectedness. Refers to pairs of nodes that can reach other, and is often expressed as a proportion.
- Density. The number of relationships in a network, and usually expressed as a proportion out of the total number of relationships possible (in a fully connected graph, or a graph where an edge is drawn between each and every node).
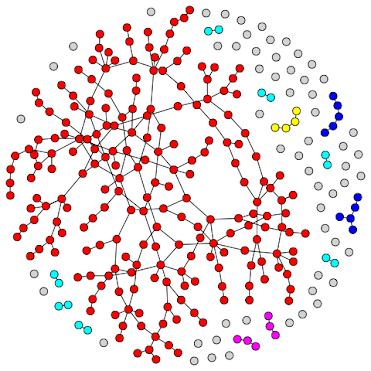
- Isolates. The number of nodes that are not connected to any others.
- Average/mean degree. Reflects the average number of relationships for each node. The momentary degree defines the number of relationships at a single point in time.
In addition to describing properties of the edges, we can describe properties of nodes in terms of how important they are to the network through measures of centrality. Highly central nodes may have large number of relationships, or may disconnect the network (break connections) by removing them.
- Degree. The number of relationships for a given node.
- Eigenvector. An alternate specification of degree that is weighted in corresponds to popularity (or risk).
- Network analysis entails identifying mechanisms for clustering, and typically will include concepts of: Sociality. The overall propensity for tie formation (overall for the network and possibly for attributes for each node).
- Selective mixing. The propensity for tie formation based on node attributes (homophily).
- Triad closure. The propensity for tie formation based on other ties.
- Edgewise shared partners. The number of edges in common between dyads.
- Geodesic distribution. A measure of the pairwise paths between nodes; i.e., a global level of how reachable people are in the network.

The basis for the type of analysis presented in these blogs posts are exponential random graph models (ERGMs), and are a class of statistical methods for generalized network inferences that use simulation approaches to test hypothesis about cohesion, where the null hypothesis is a connection based on chance alone (i.e., a random network). These models are analogous to the familiar regression models from epidemiological analysis and carry some of the same assumptions and caveats. Model degeneracy is the failure of estimated network to produce the observed network (and can manifest as failed convergence or lack of model fit). When creating these models, one needs network data: the individuals in the network and their relationships. In an ideal world, we would have network census data, where we know each and every person in the network and their relations to everyone else. In the practical epidemiology world, we most likely have egocentric data, where we don't know individual relationships, but have some global statistics such as the number of relationships, concurrent partners, duration, etc.
...continue to Part 3...
Cite: Goldstein ND. Social Network Analysis in Epidemiology: Part 2. Jul 27, 2016. DOI: 10.17918/goldsteinepi.
